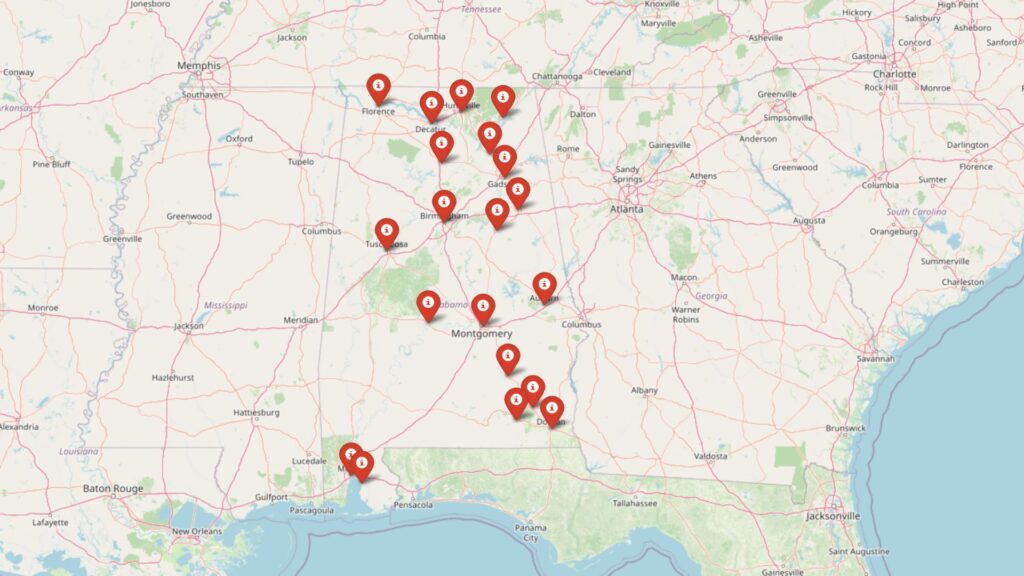
According to Zillow’s home value data through November 2024, Alabama’s property market shows distinct geographical patterns with coastal and lakefront communities experiencing the most dramatic growth. The data reveals Mountain Brook maintaining its position as the state’s most expensive market at $917,085, while coastal communities like Orange Beach ($691,580) and lake-adjacent towns like Equality ($686,561) follow closely behind, highlighting the premium placed on waterfront locations. Most notably, smaller waterfront communities like Elberta, Dauphin Island, and Jacksons Gap posted the highest percentage gains since 2015, with increases ranging from 118% to 125%, far outpacing larger suburban markets.
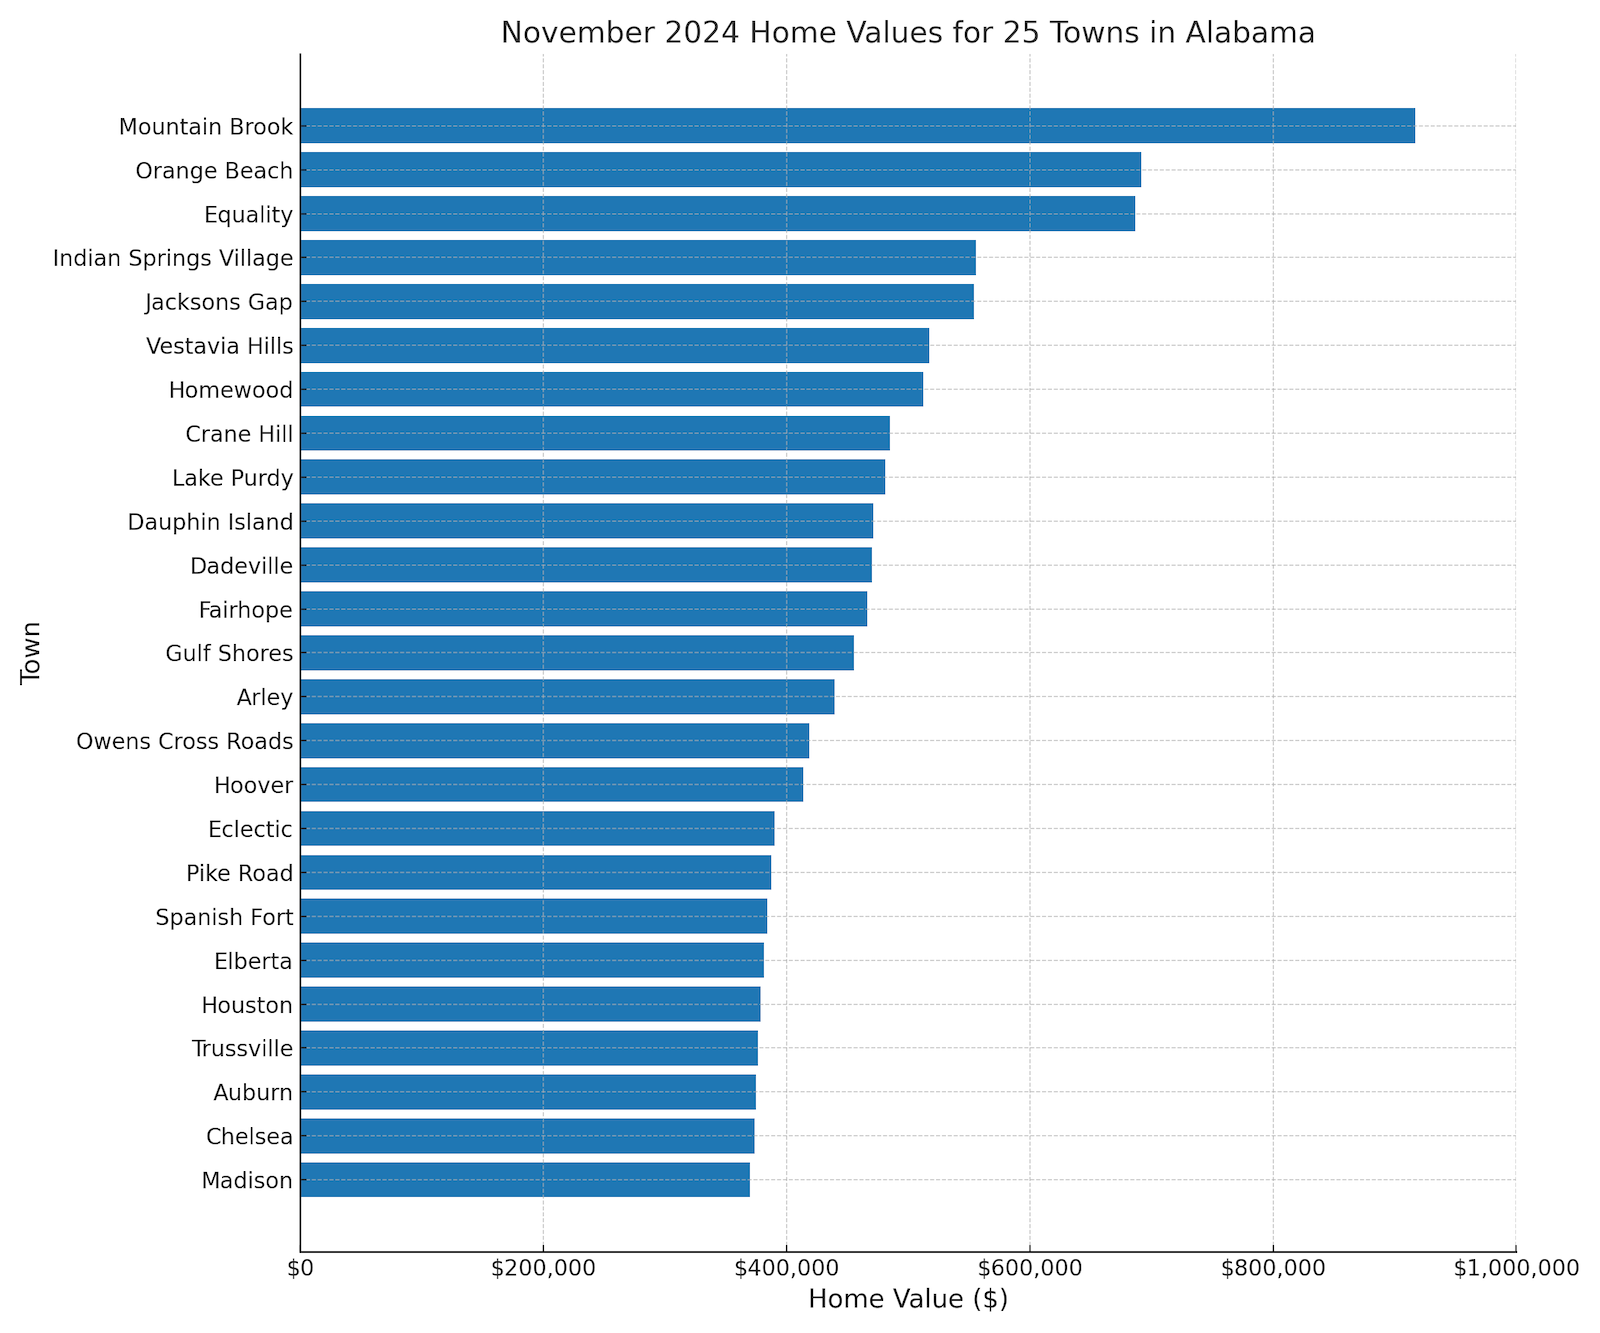
Overview Chart
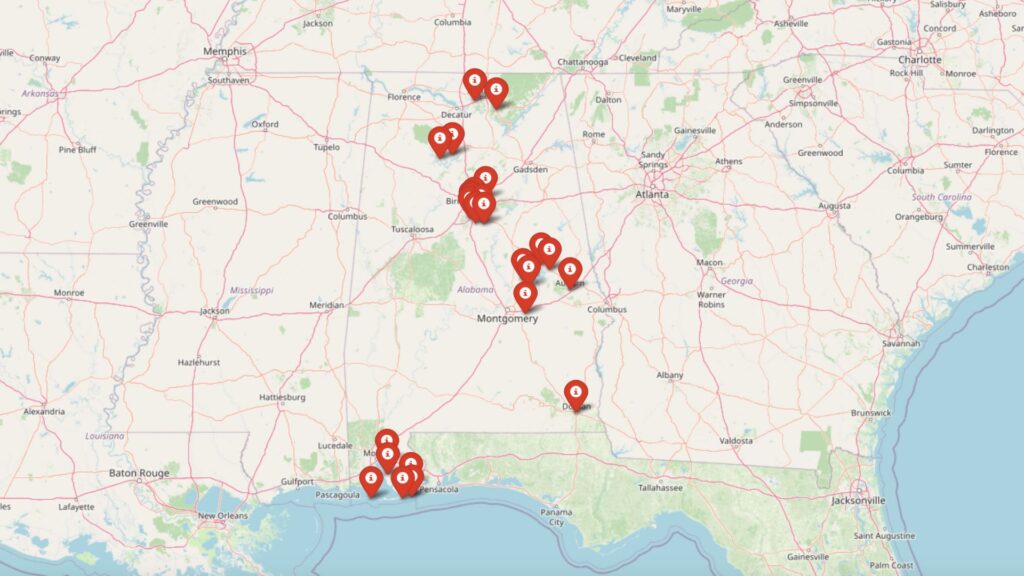
The analysis also demonstrates the economic impact of Alabama’s major employment centers, with Huntsville’s tech corridor boosting values in Madison and Owens Cross Roads, while Birmingham’s “Over the Mountain” suburbs like Mountain Brook, Vestavia Hills, and Homewood maintain their traditional premium positions. Particularly interesting is the emergence of lake communities as luxury markets, with three Lake Martin adjacent towns (Equality, Jacksons Gap, and Dadeville) all posting values above $470,000 by late 2024, marking a significant shift from their historically modest market positions. The coastal region shows similar strength, with all Gulf Coast communities in the dataset averaging over 90% appreciation since 2015, suggesting a sustained demand for beach and waterfront properties despite hurricane risks and insurance challenges.
The order is most expensive to least expensive home values. Towns selected based on 2024 home value figures (i.e. not an averaging of all years shown in the following charts).
1. Mountain Brook, AL
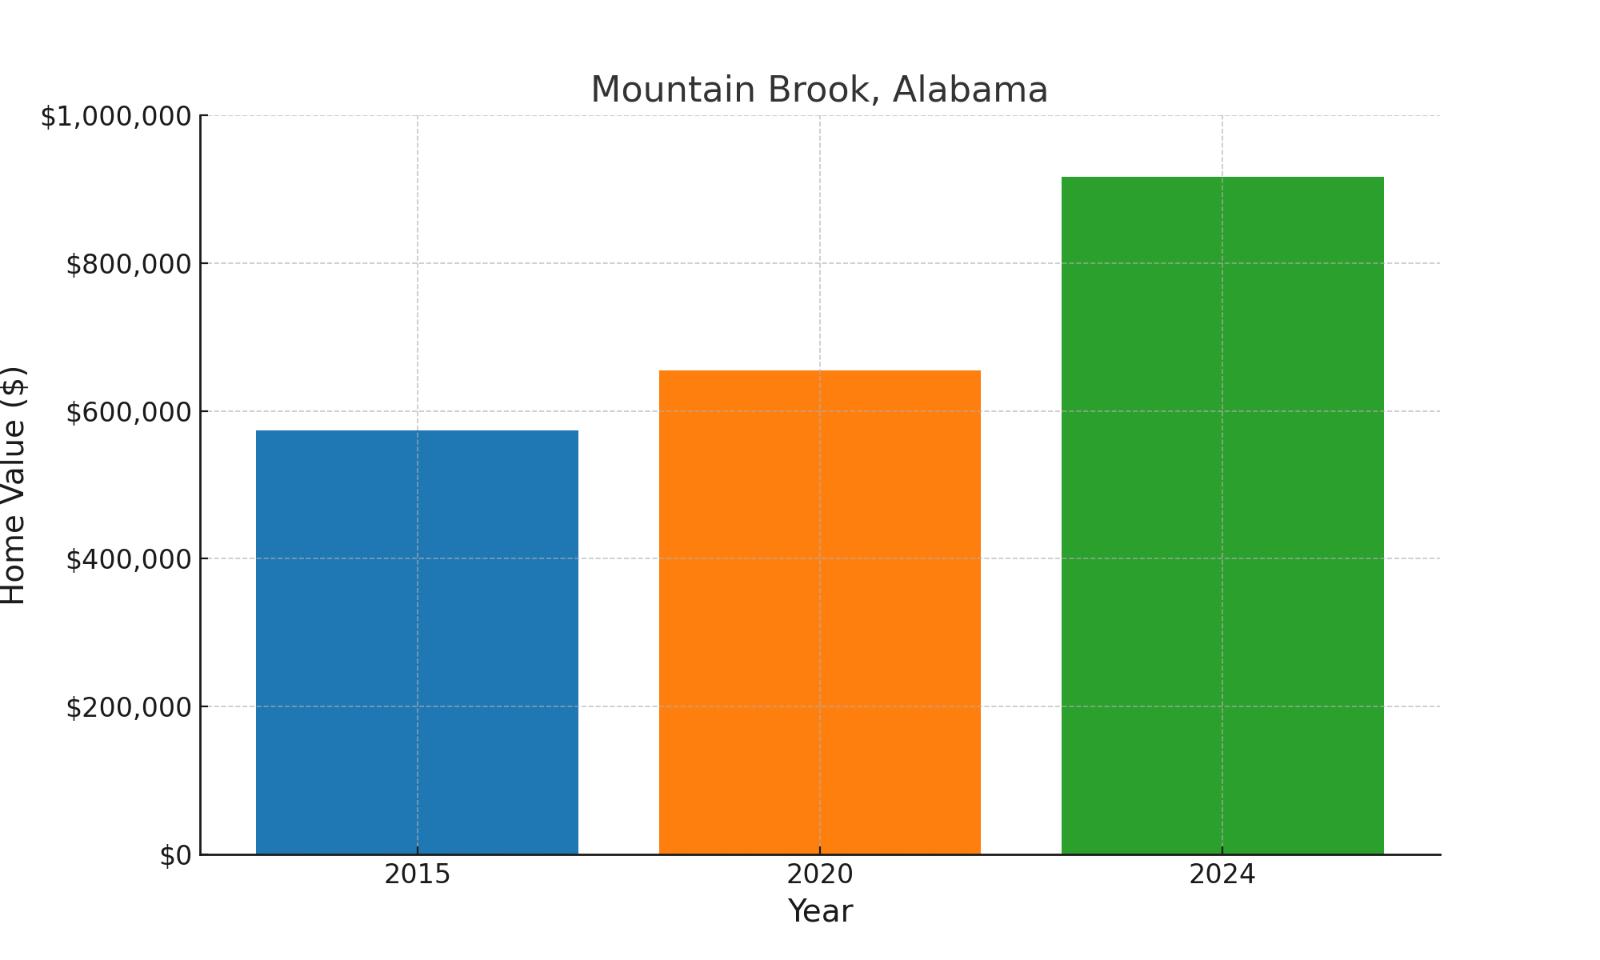
Located over the mountain from Birmingham and consistently ranked as Alabama’s wealthiest city, Mountain Brook is known for its pristine neighborhoods and top-rated schools. Values: 2015: $573,247; 2020: $654,690; 2024: $917,085 (60% total increase, 40.1% since 2020).
2. Orange Beach, AL
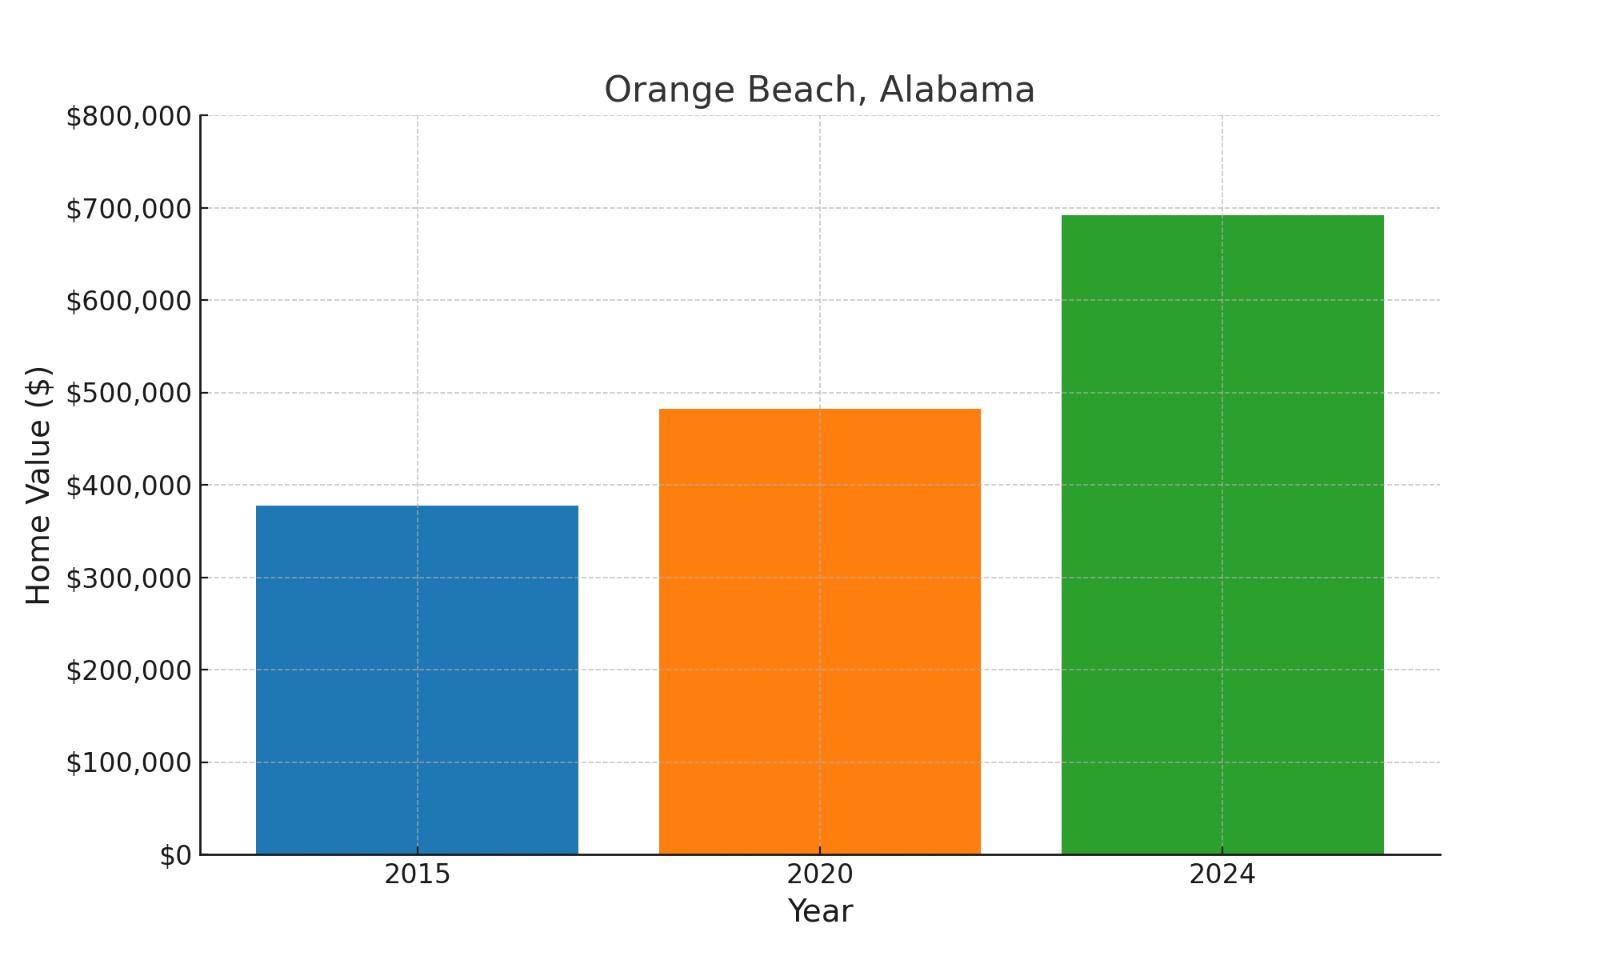
Situated on Alabama’s Gulf Coast between Gulf Shores and Perdido Key, Florida, Orange Beach is known for its white-sand beaches and coastal attractions. Values: 2015: $377,477; 2020: $482,051; 2024: $691,580 (83.2% total increase, 43.5% since 2020).
3. Equality, AL
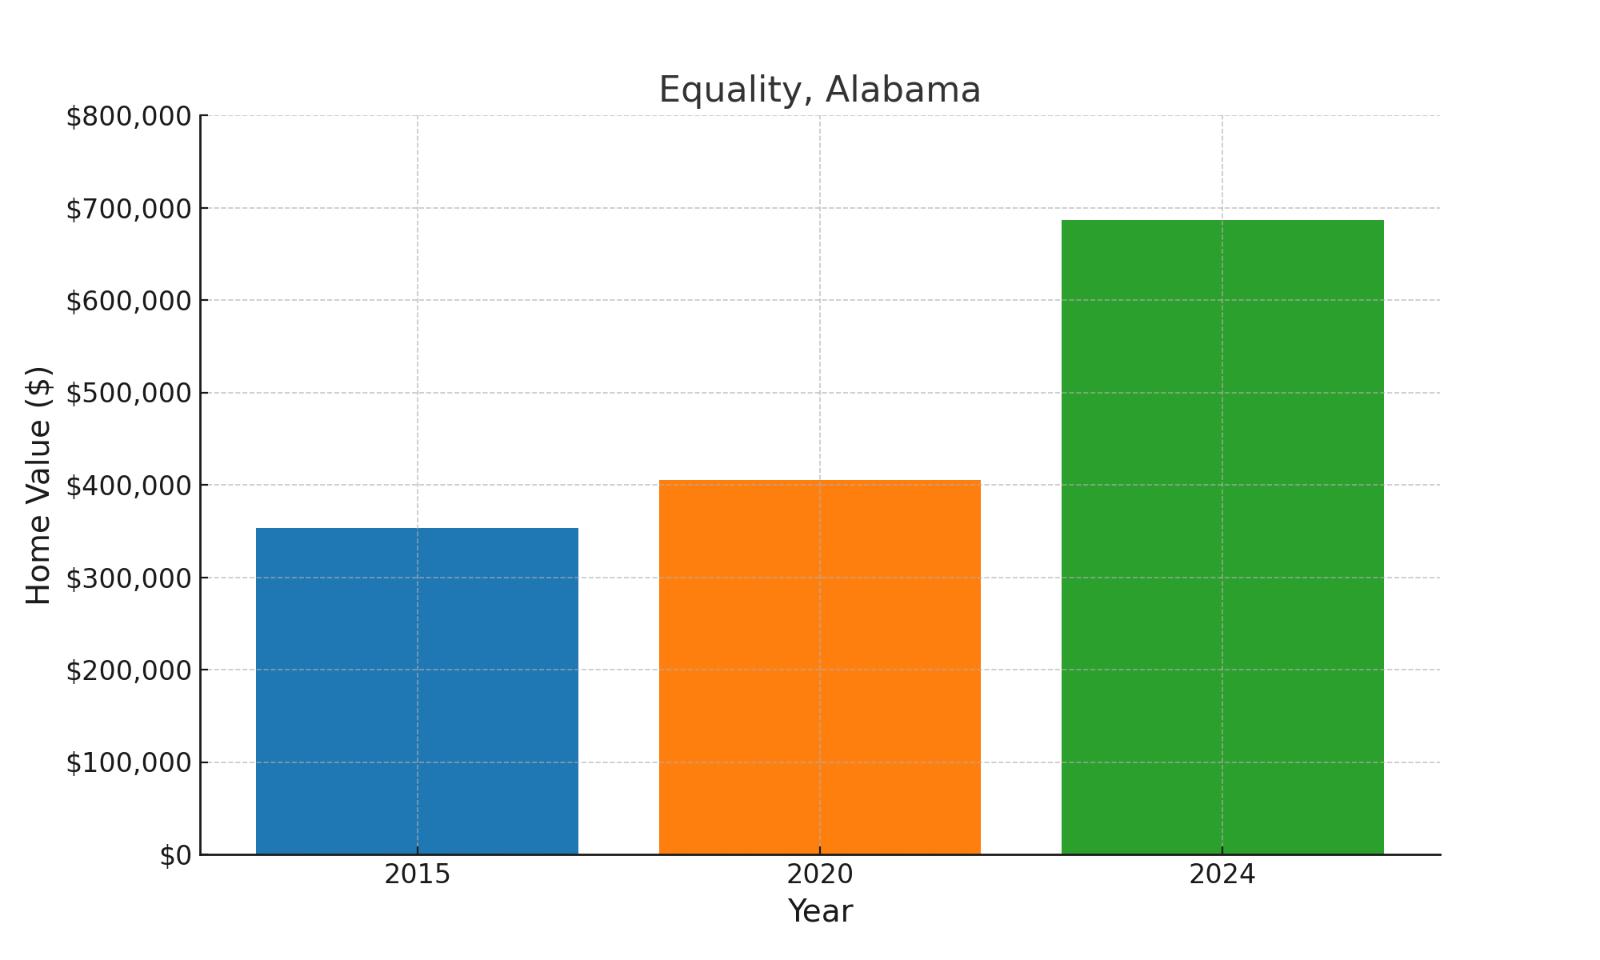
A small town in Coosa County near Lake Martin, Equality offers lakeside living and rural charm about 20 miles from Alexander City. Values: 2015: $353,524; 2020: $405,394; 2024: $686,561 (94.2% total increase, 69.4% since 2020).
4. Indian Springs Village, AL
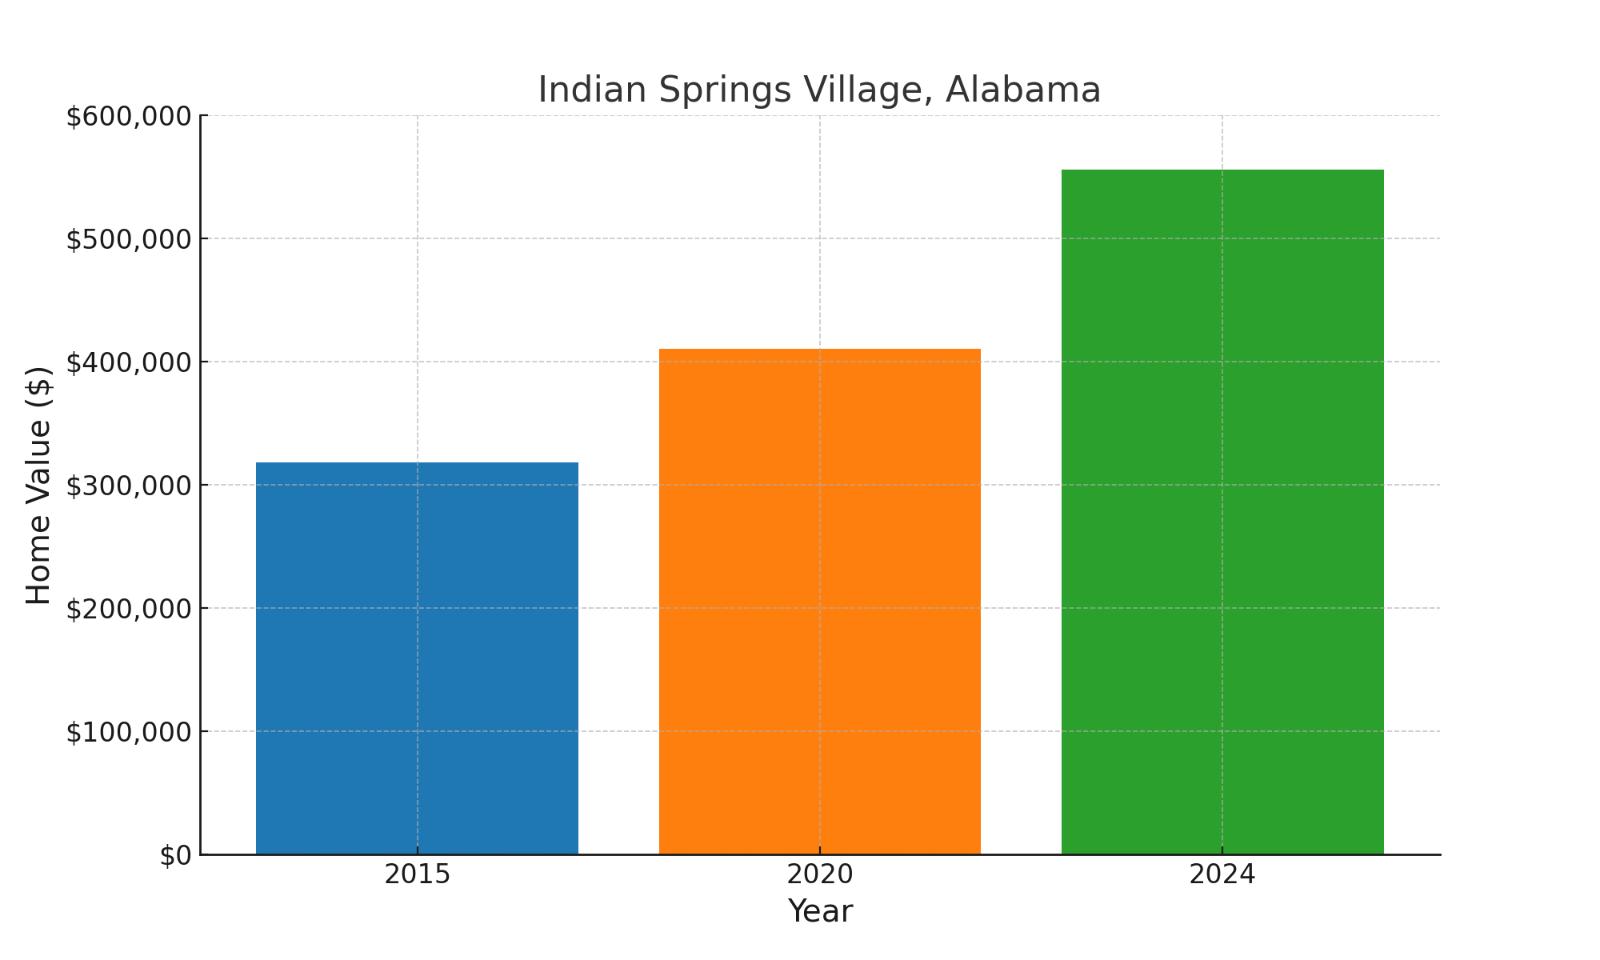
Located in Shelby County just southeast of Birmingham, this exclusive residential community borders Oak Mountain State Park. Values: 2015: $317,928; 2020: $410,495; 2024: $555,992 (74.9% total increase, 35.4% since 2020).
5. Jacksons Gap, AL
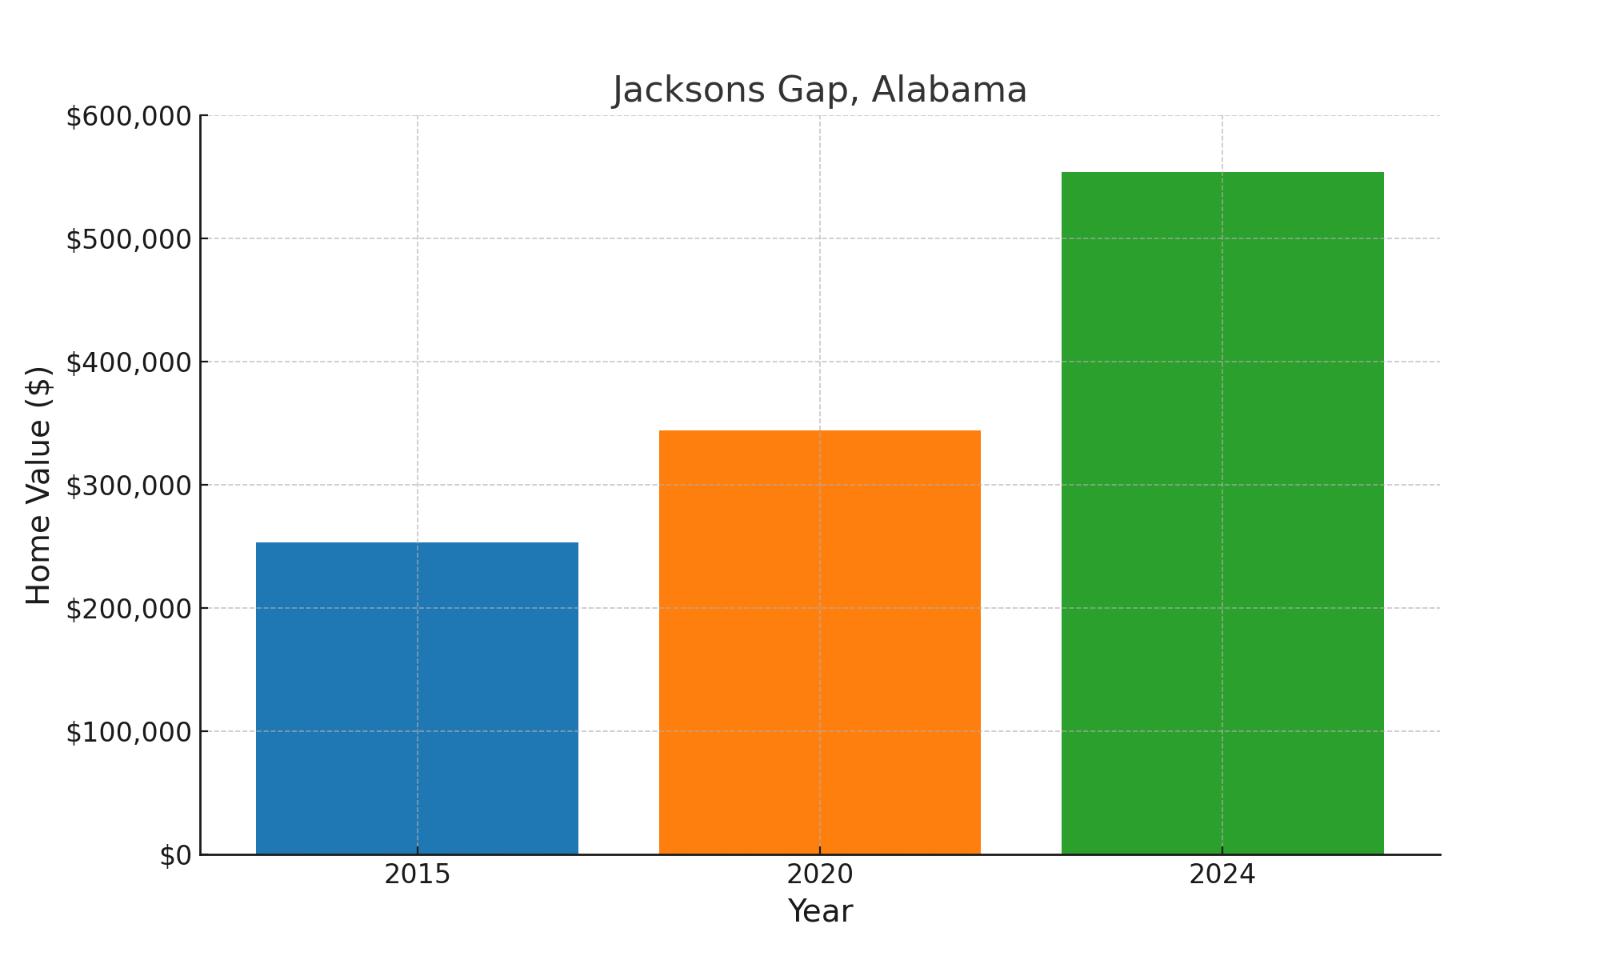
Positioned on the southern shores of Lake Martin in Tallapoosa County, this lakeside community sits approximately 15 miles from Alexander City. Values: 2015: $253,475; 2020: $343,986; 2024: $554,115 (118.6% total increase, 61.1% since 2020).
6. Vestavia Hills, AL
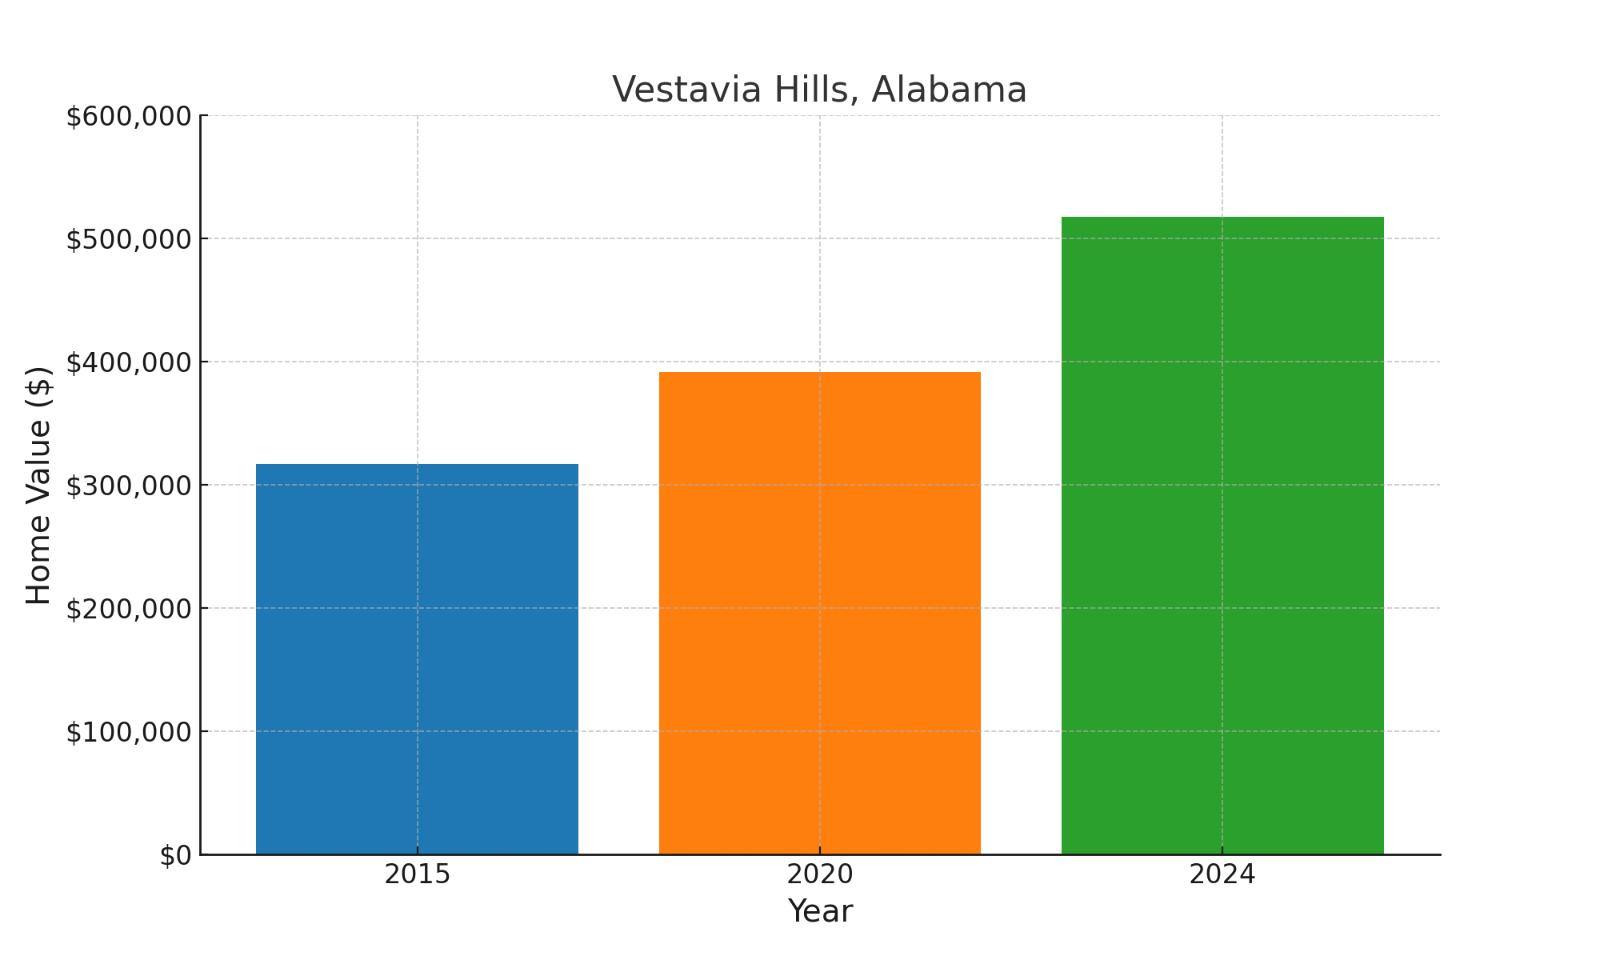
An upscale suburb immediately south of Birmingham, straddling Shades Mountain and known for its excellent school system. Values: 2015: $316,821; 2020: $391,488; 2024: $517,462 (63.3% total increase, 32.2% since 2020).
7. Homewood, AL
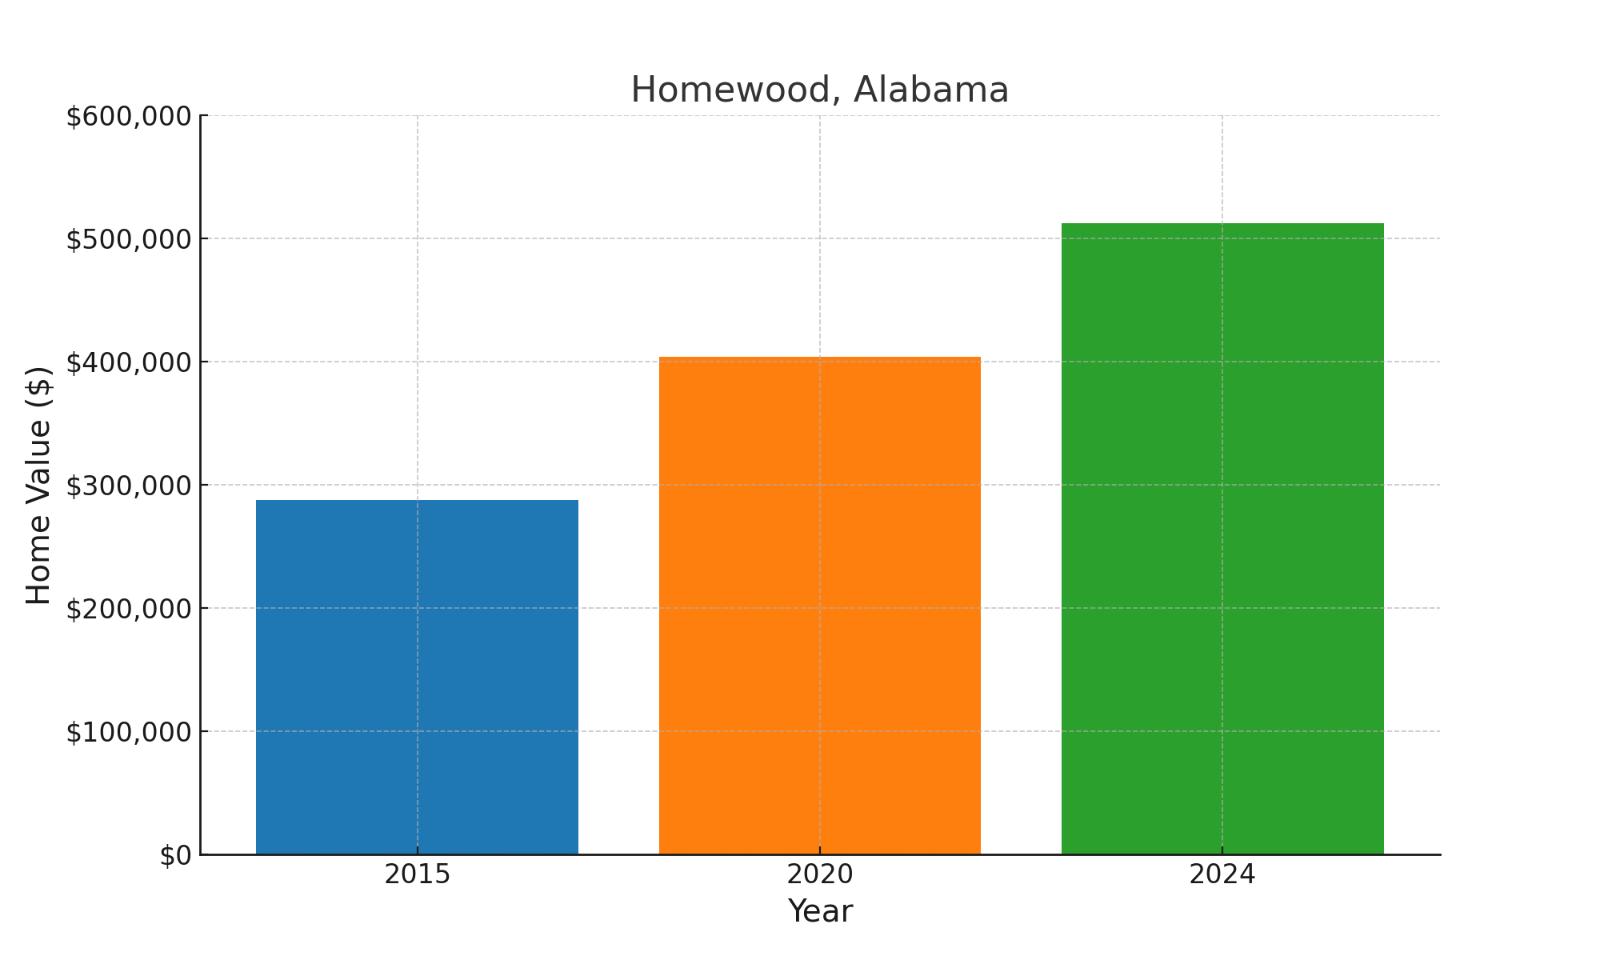
Located directly south of Birmingham’s city center, this walkable suburb is home to Samford University and the popular Homewood downtown district. Values: 2015: $287,854; 2020: $404,147; 2024: $512,515 (78% total increase, 26.8% since 2020).
8. Crane Hill, AL
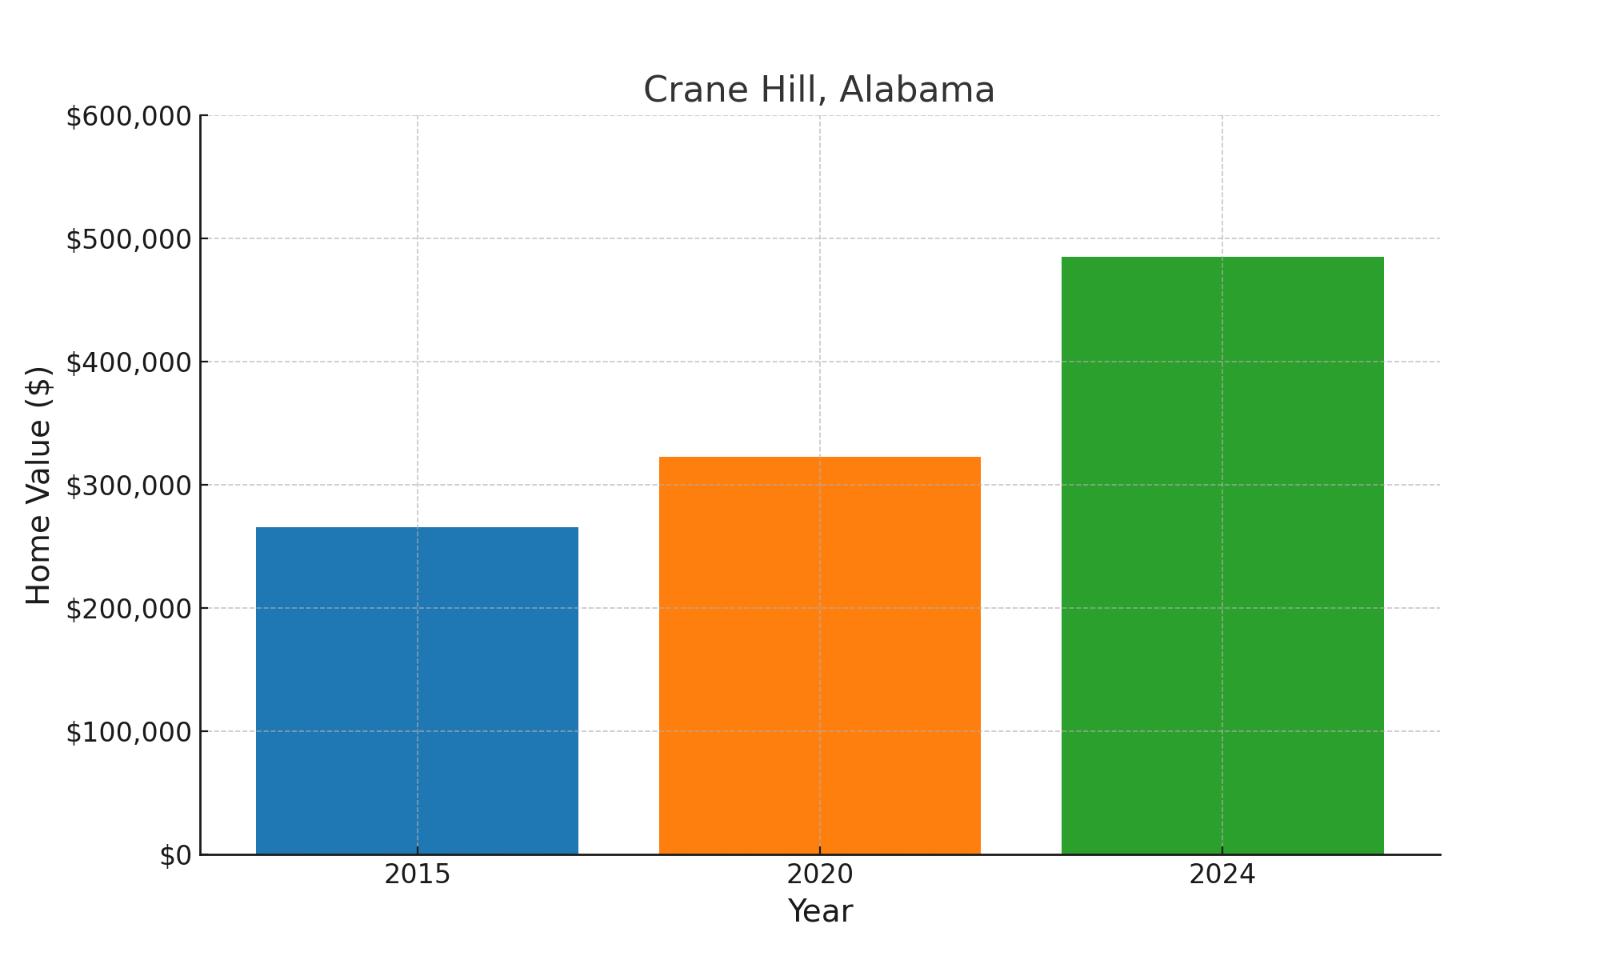
Situated along Smith Lake in Cullman County, about 50 miles north of Birmingham, this community is known for its waterfront properties. Values: 2015: $265,523; 2020: $322,511; 2024: $485,038 (82.7% total increase, 50.4% since 2020).
9. Lake Purdy, AL
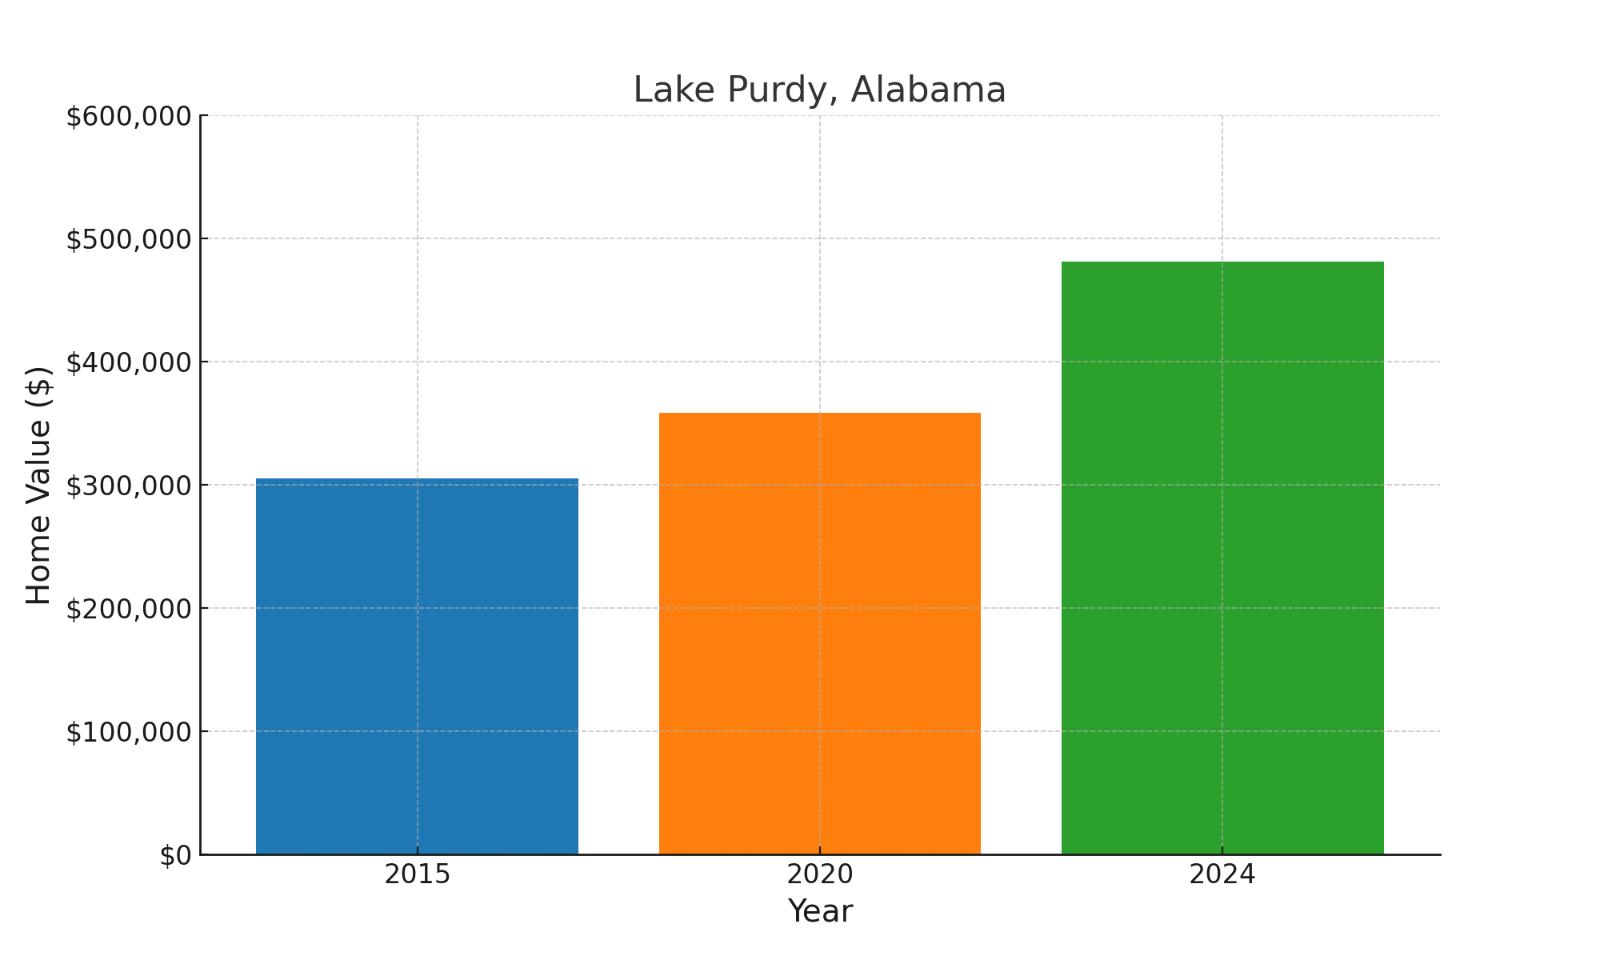
Located southeast of Birmingham near the Lake Purdy reservoir, this community straddles Jefferson and Shelby counties. Values: 2015: $305,468; 2020: $358,425; 2024: $481,082 (57.5% total increase, 34.2% since 2020).
10. Dauphin Island, AL
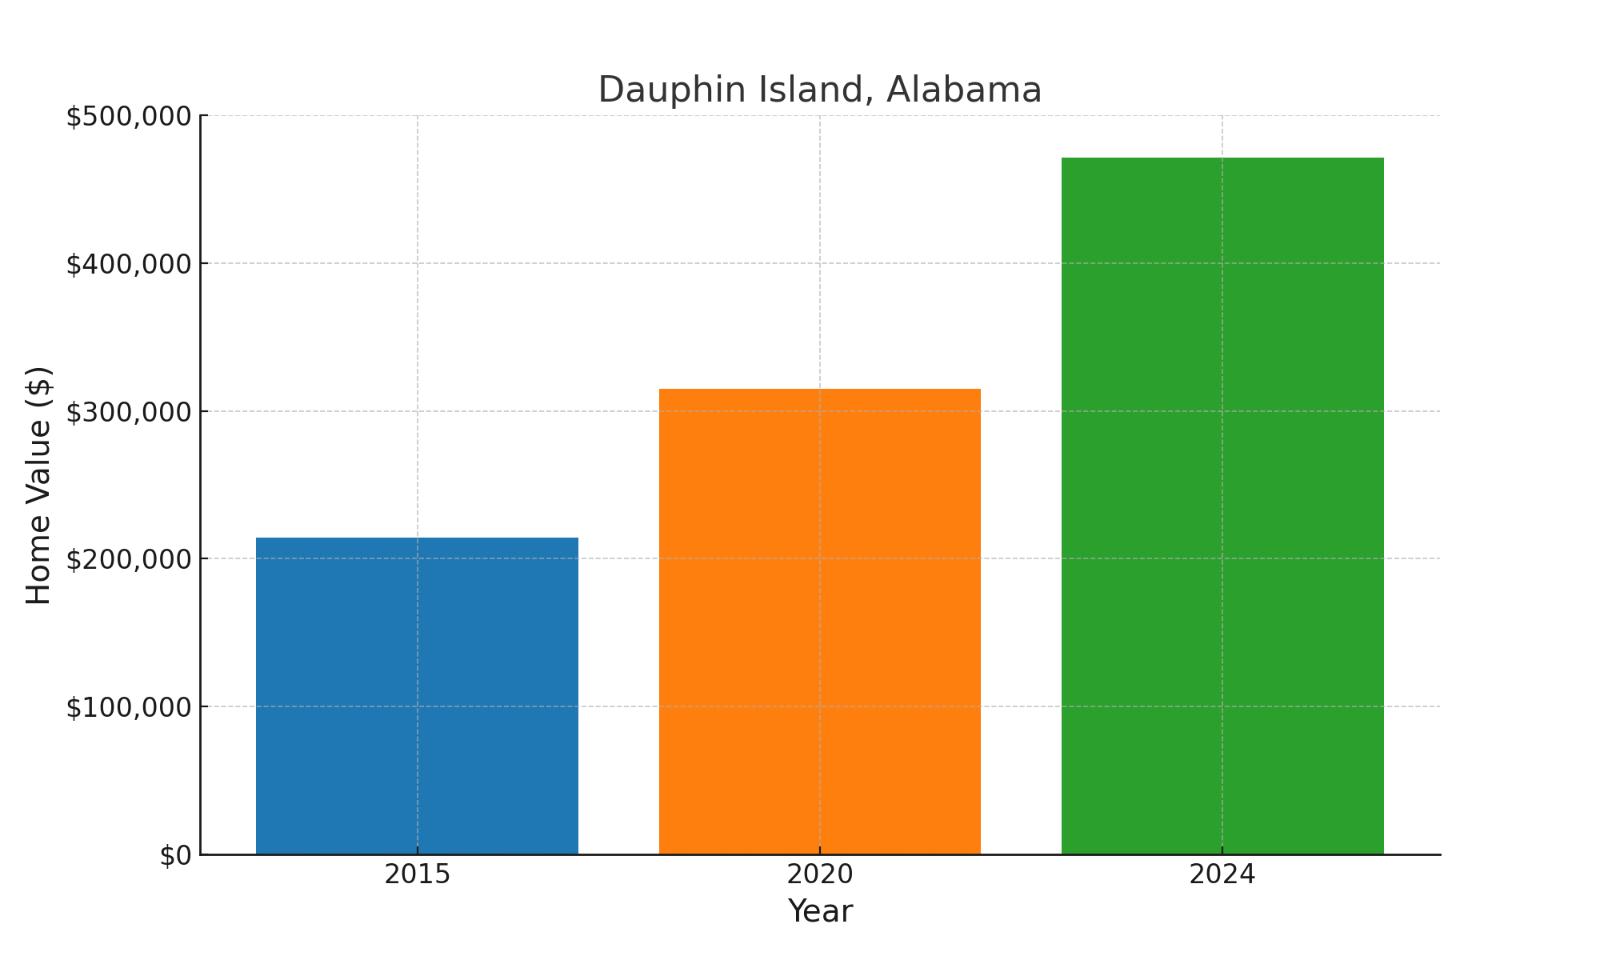
A barrier island in the Gulf of Mexico, connected to Mobile County by a three-mile bridge, known for its beaches and bird sanctuaries. Values: 2015: $214,330; 2020: $314,756; 2024: $471,224 (119.9% total increase, 49.7% since 2020).
11. Dadeville, AL
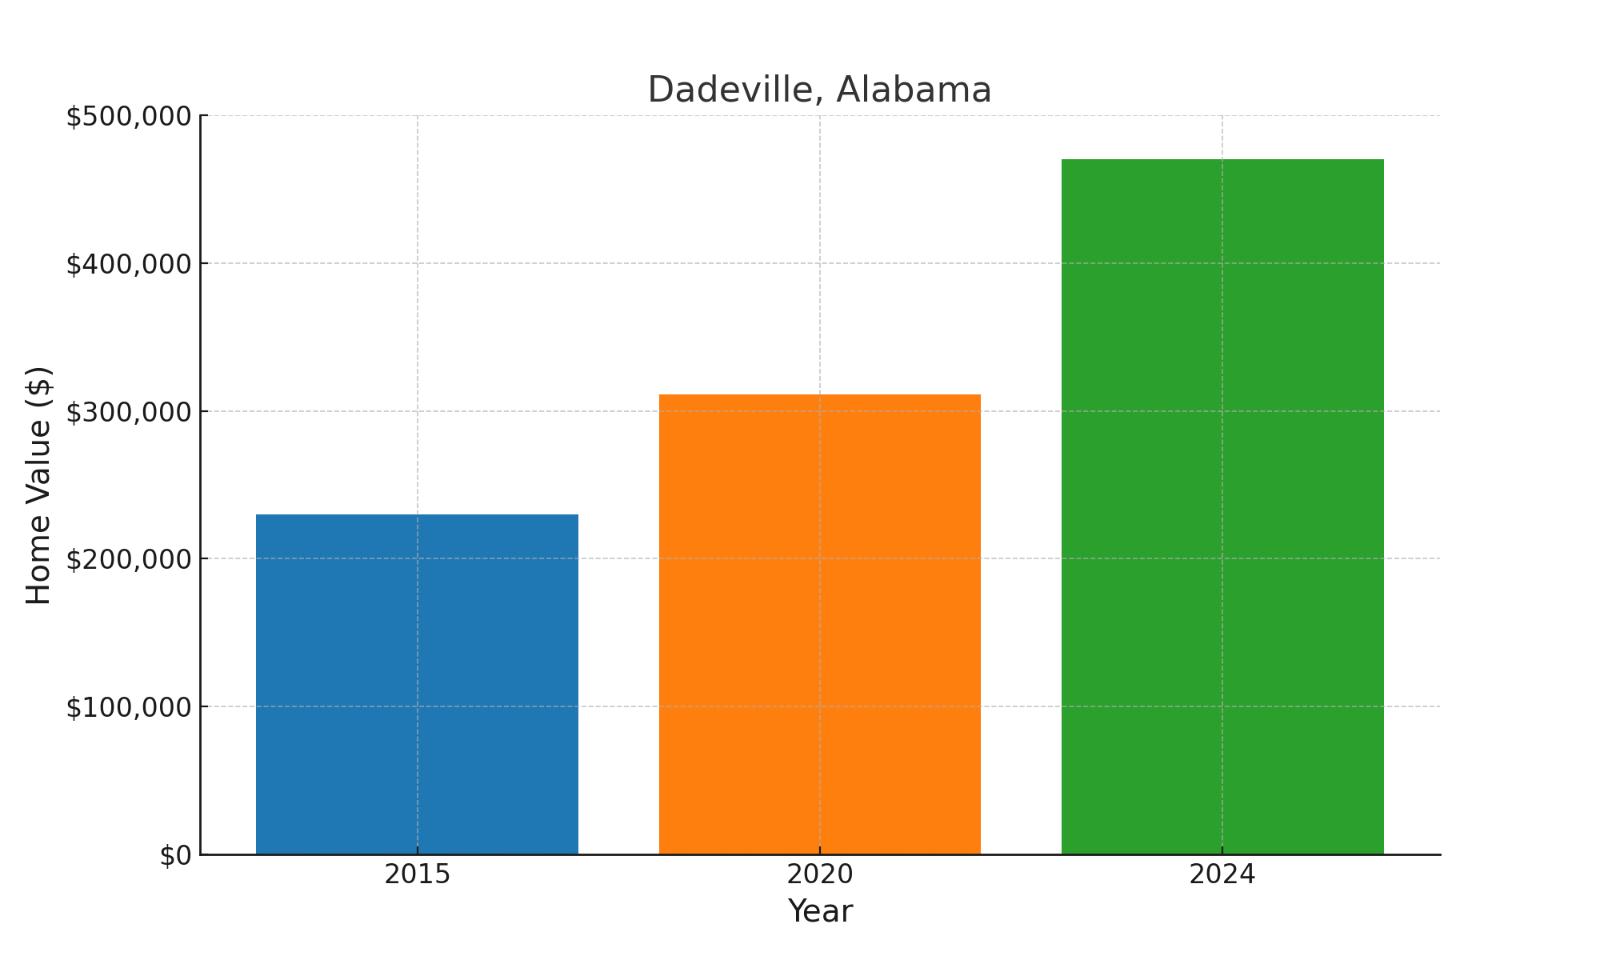
The county seat of Tallapoosa County, positioned on the northern shores of Lake Martin about 25 miles northeast of Auburn. Values: 2015: $230,045; 2020: $311,336; 2024: $470,299 (104.4% total increase, 51.1% since 2020).
12. Fairhope, AL
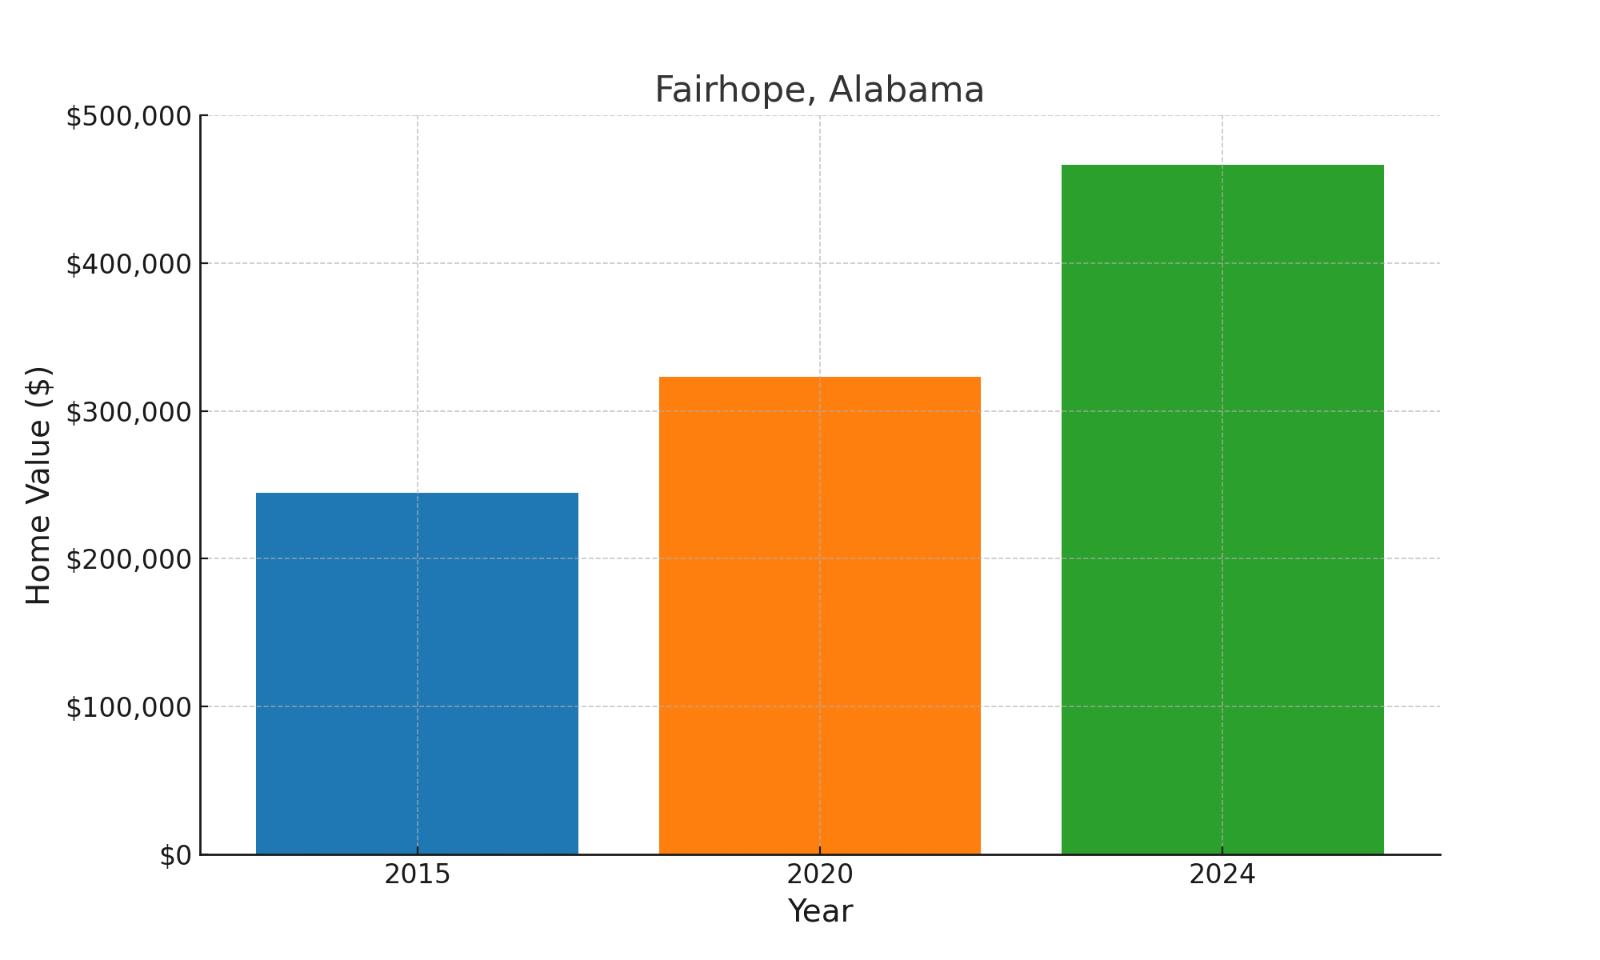
A picturesque city on Mobile Bay’s eastern shore, known for its arts community and scenic downtown. Values: 2015: $244,429; 2020: $323,070; 2024: $466,259 (90.8% total increase, 44.3% since 2020).
13. Gulf Shores, AL
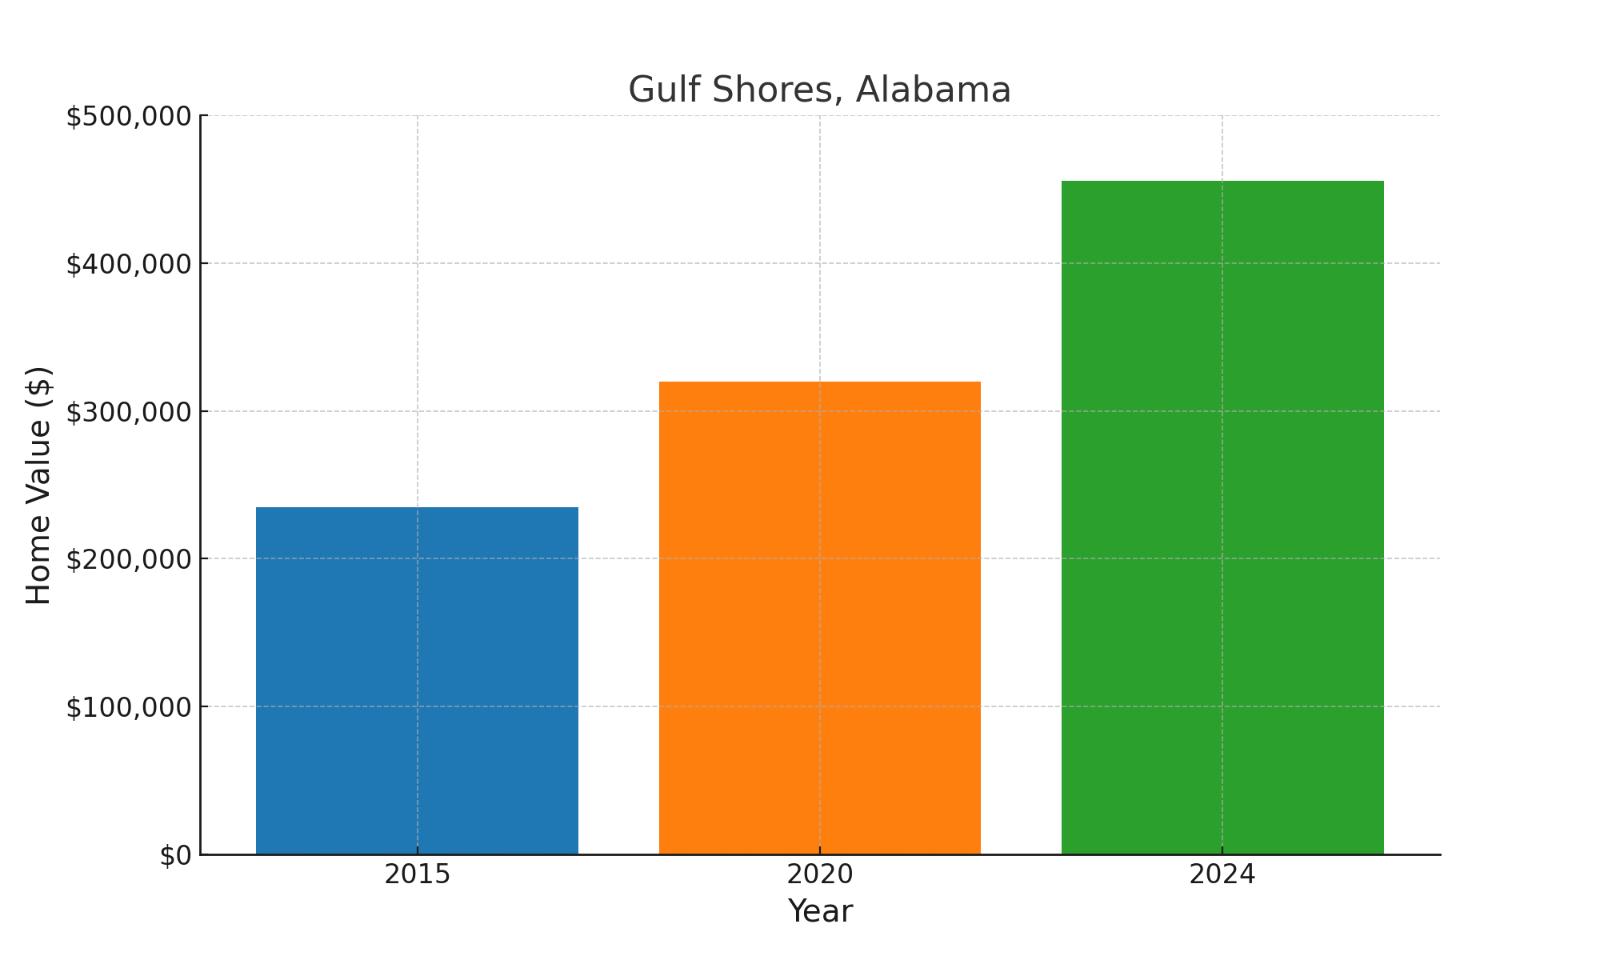
Alabama’s premier beach destination, located on the Gulf of Mexico at the state’s southernmost tip. Values: 2015: $234,968; 2020: $319,735; 2024: $455,409 (93.8% total increase, 42.4% since 2020).
14. Arley, AL
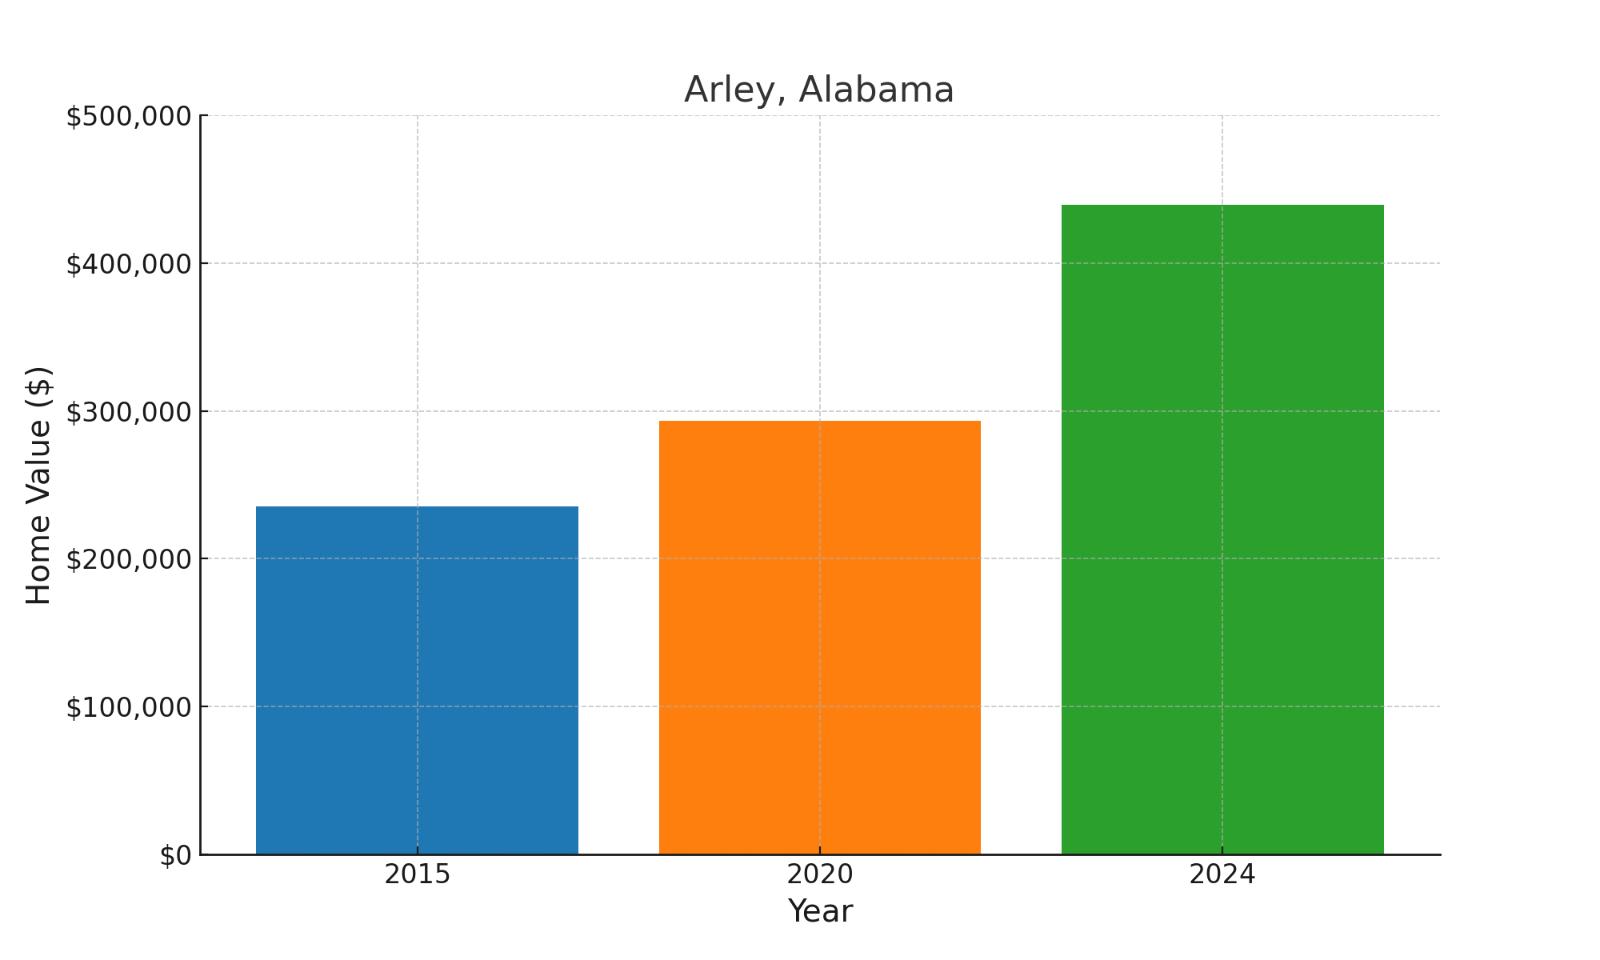
A small town in Winston County on Smith Lake, about 60 miles northwest of Birmingham. Values: 2015: $235,227; 2020: $293,164; 2024: $439,299 (86.8% total increase, 49.8% since 2020).
15. Owens Cross Roads, AL

A growing suburb southeast of Huntsville, nestled at the foot of Monte Sano Mountain. Values: 2015: $253,203; 2020: $295,233; 2024: $418,618 (65.3% total increase, 41.8% since 2020).
16. Hoover, AL
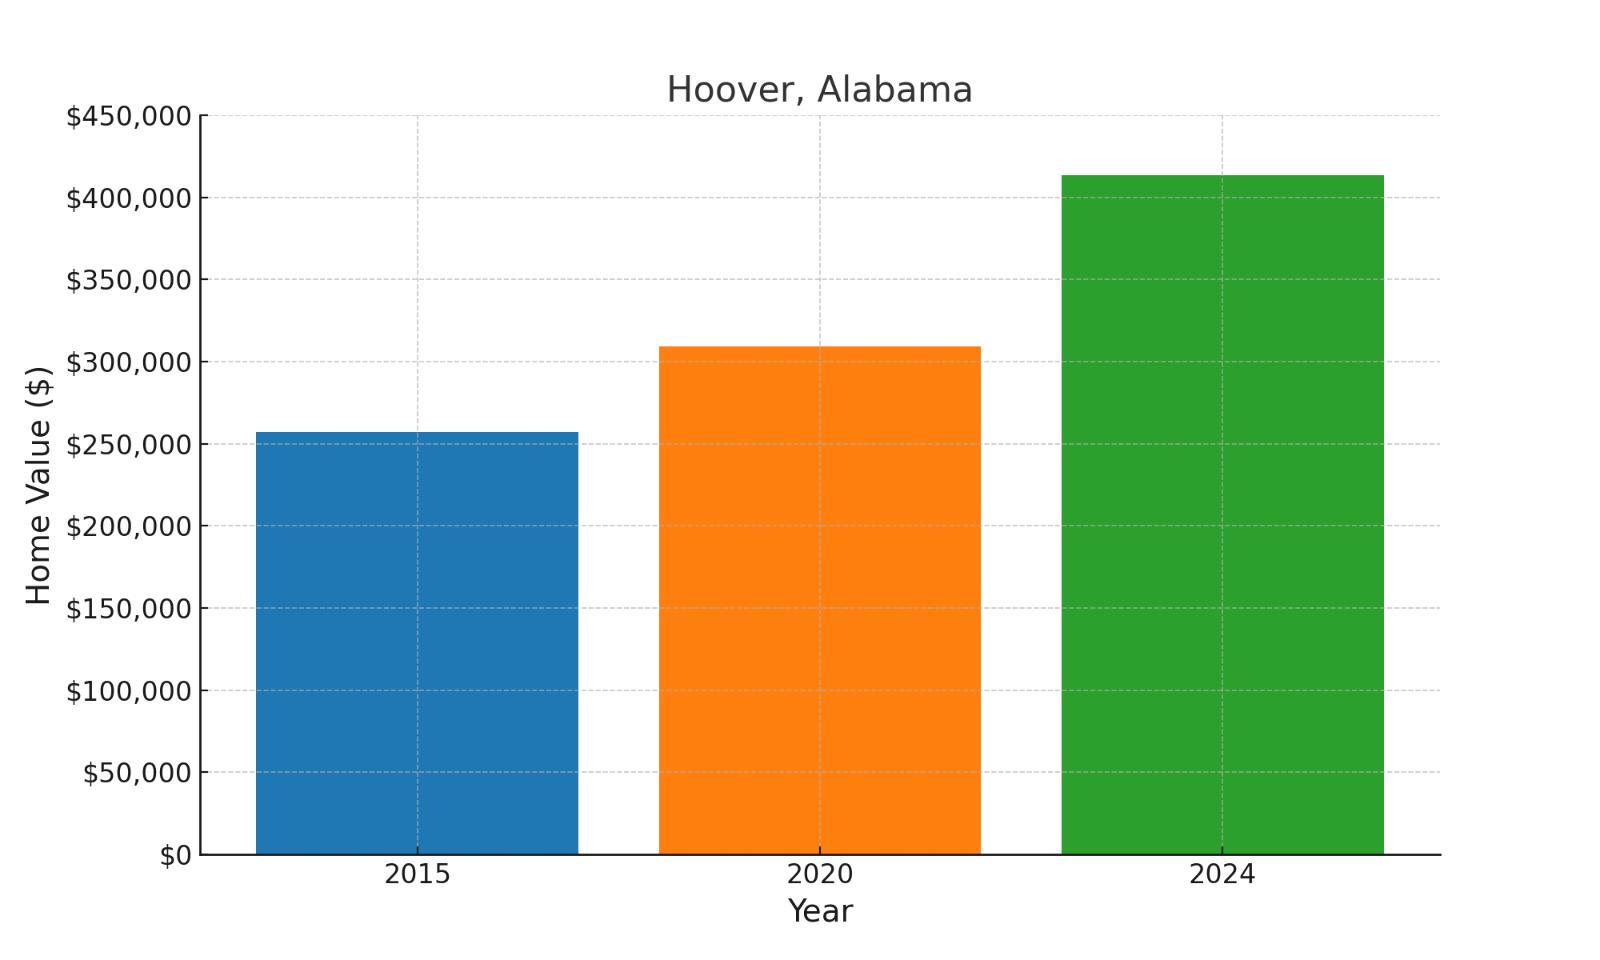
Birmingham’s largest suburb, spanning parts of Jefferson and Shelby counties, known for its Galleria shopping district. Values: 2015: $257,081; 2020: $309,420; 2024: $413,582 (60.9% total increase, 33.7% since 2020).
17. Eclectic, AL
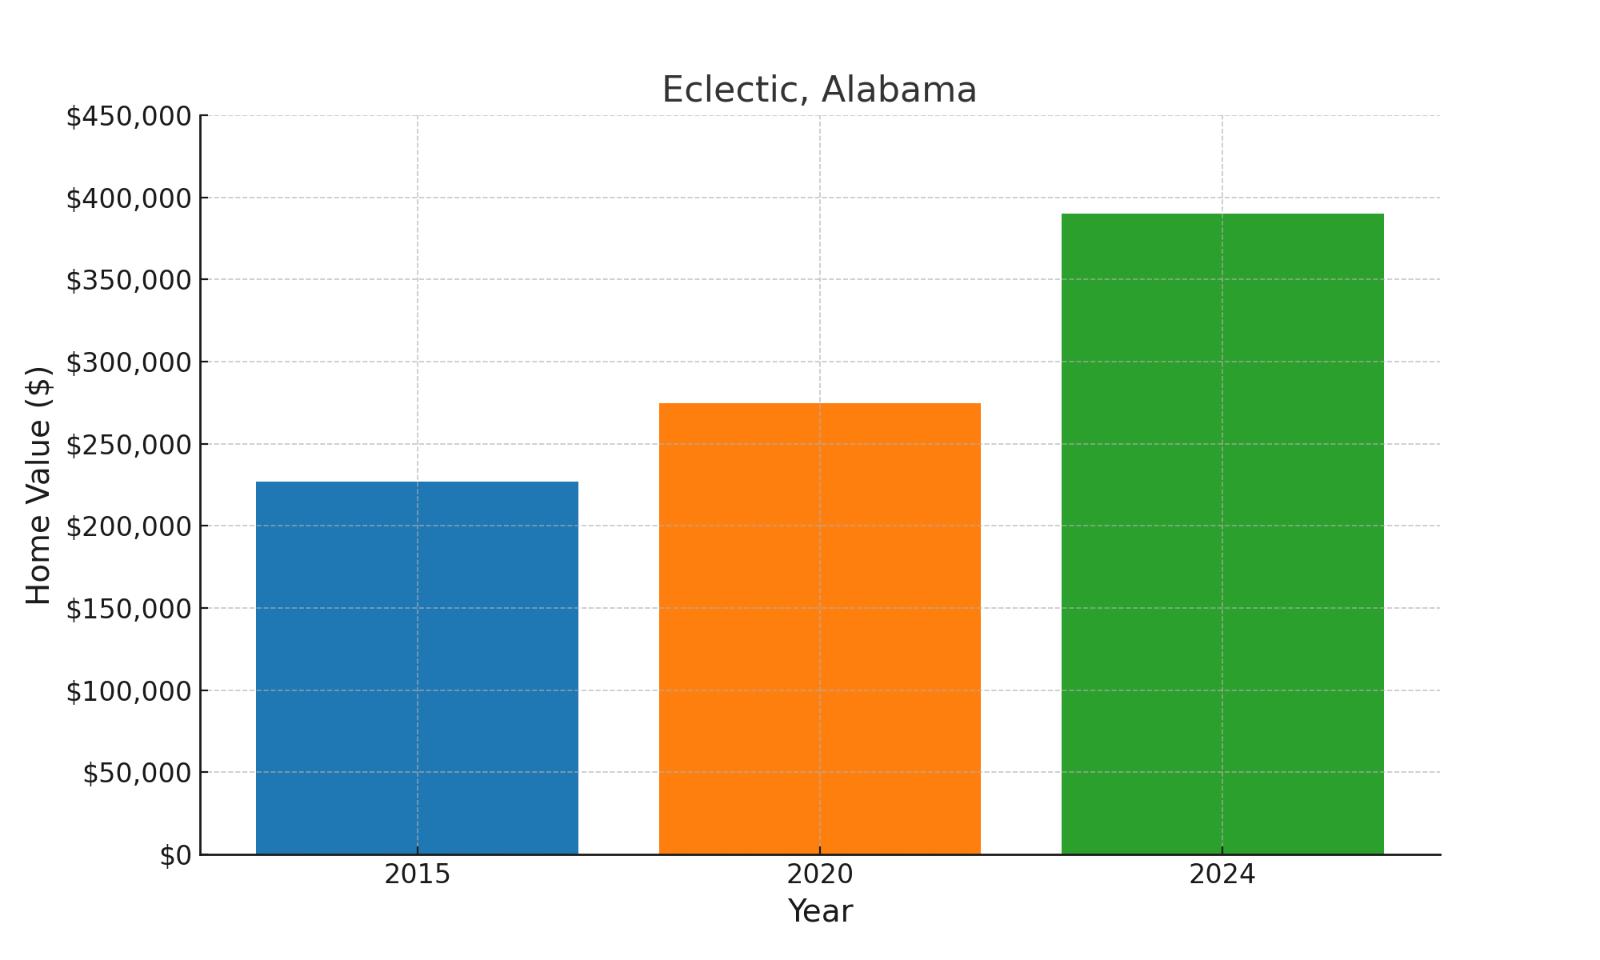
A small town in Elmore County, about 30 miles northeast of Montgomery and near Lake Martin. Values: 2015: $226,809; 2020: $274,914; 2024: $390,171 (72% total increase, 41.9% since 2020).
18. Pike Road, AL
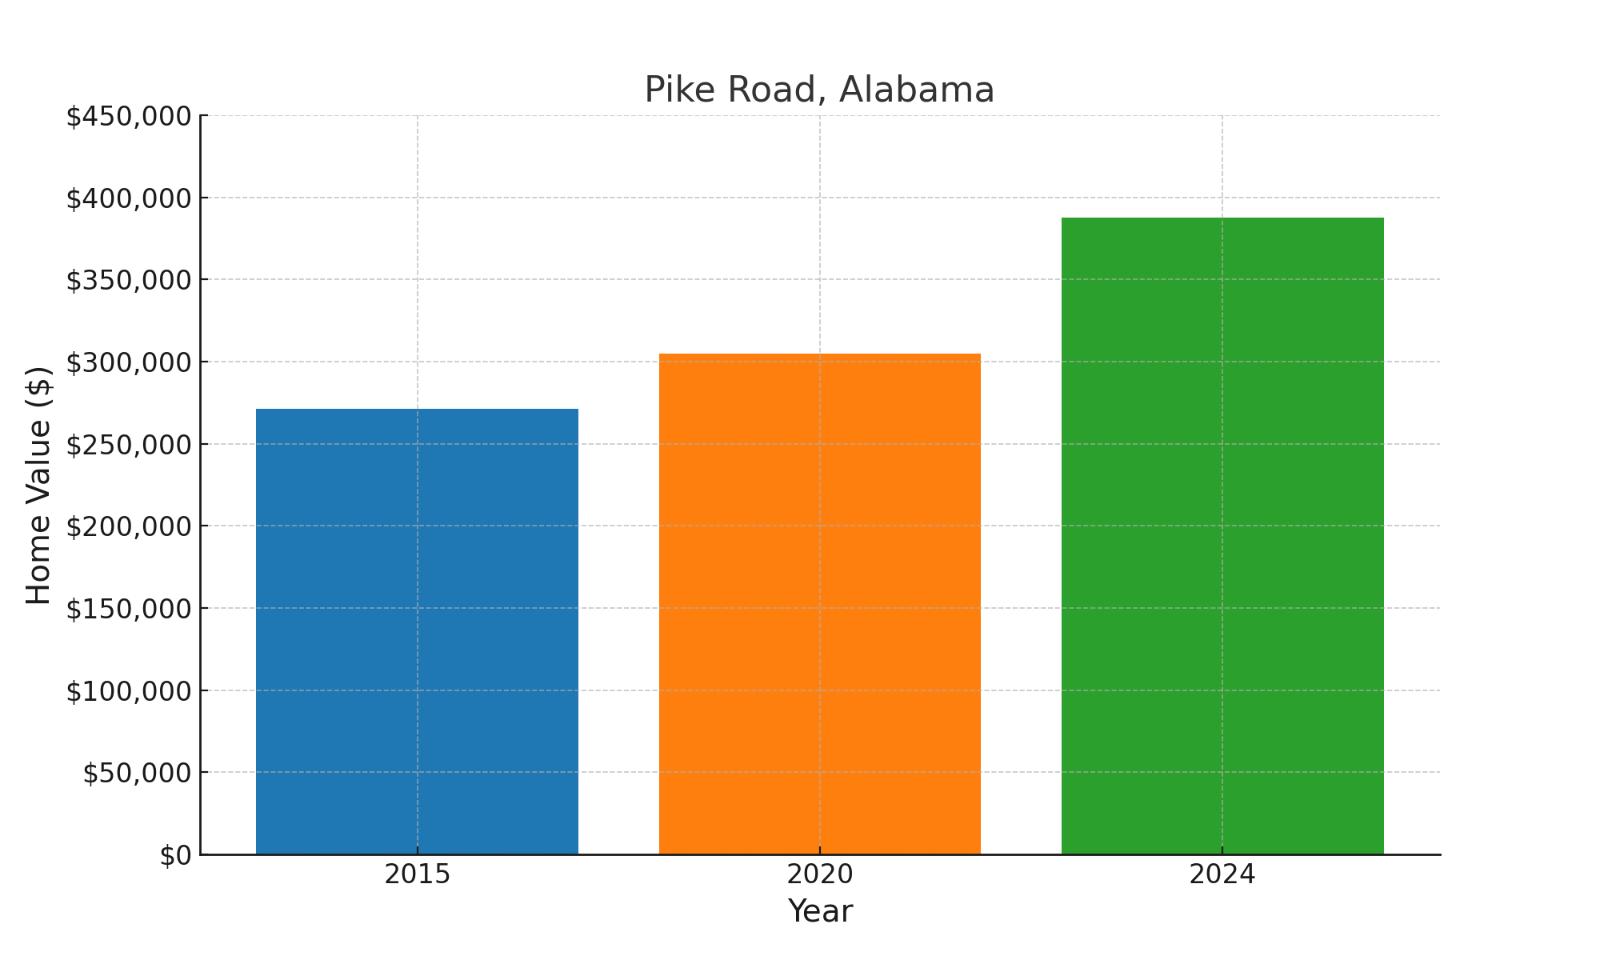
A rapidly growing suburb east of Montgomery, known for its rural character and master-planned communities. Values: 2015: $271,260; 2020: $304,841; 2024: $387,537 (42.9% total increase, 27.1% since 2020).
19. Spanish Fort, AL
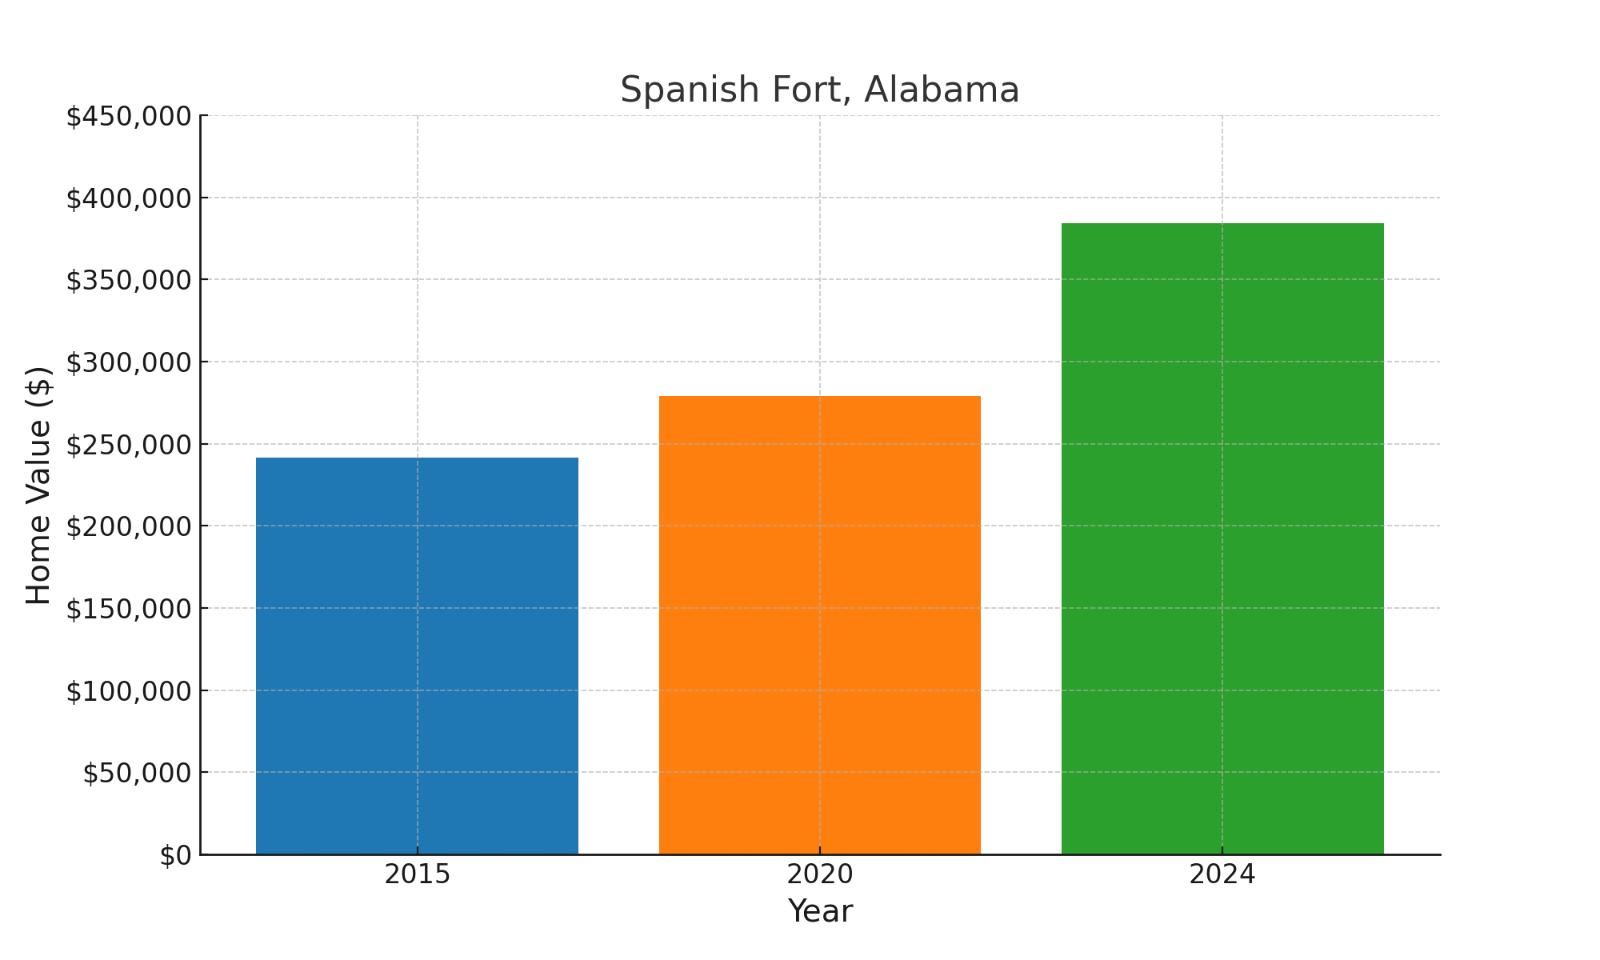
Located on Mobile Bay’s eastern shore in Baldwin County, just north of Daphne. Values: 2015: $241,648; 2020: $278,880; 2024: $384,284 (59% total increase, 37.8% since 2020).
20. Elberta, AL
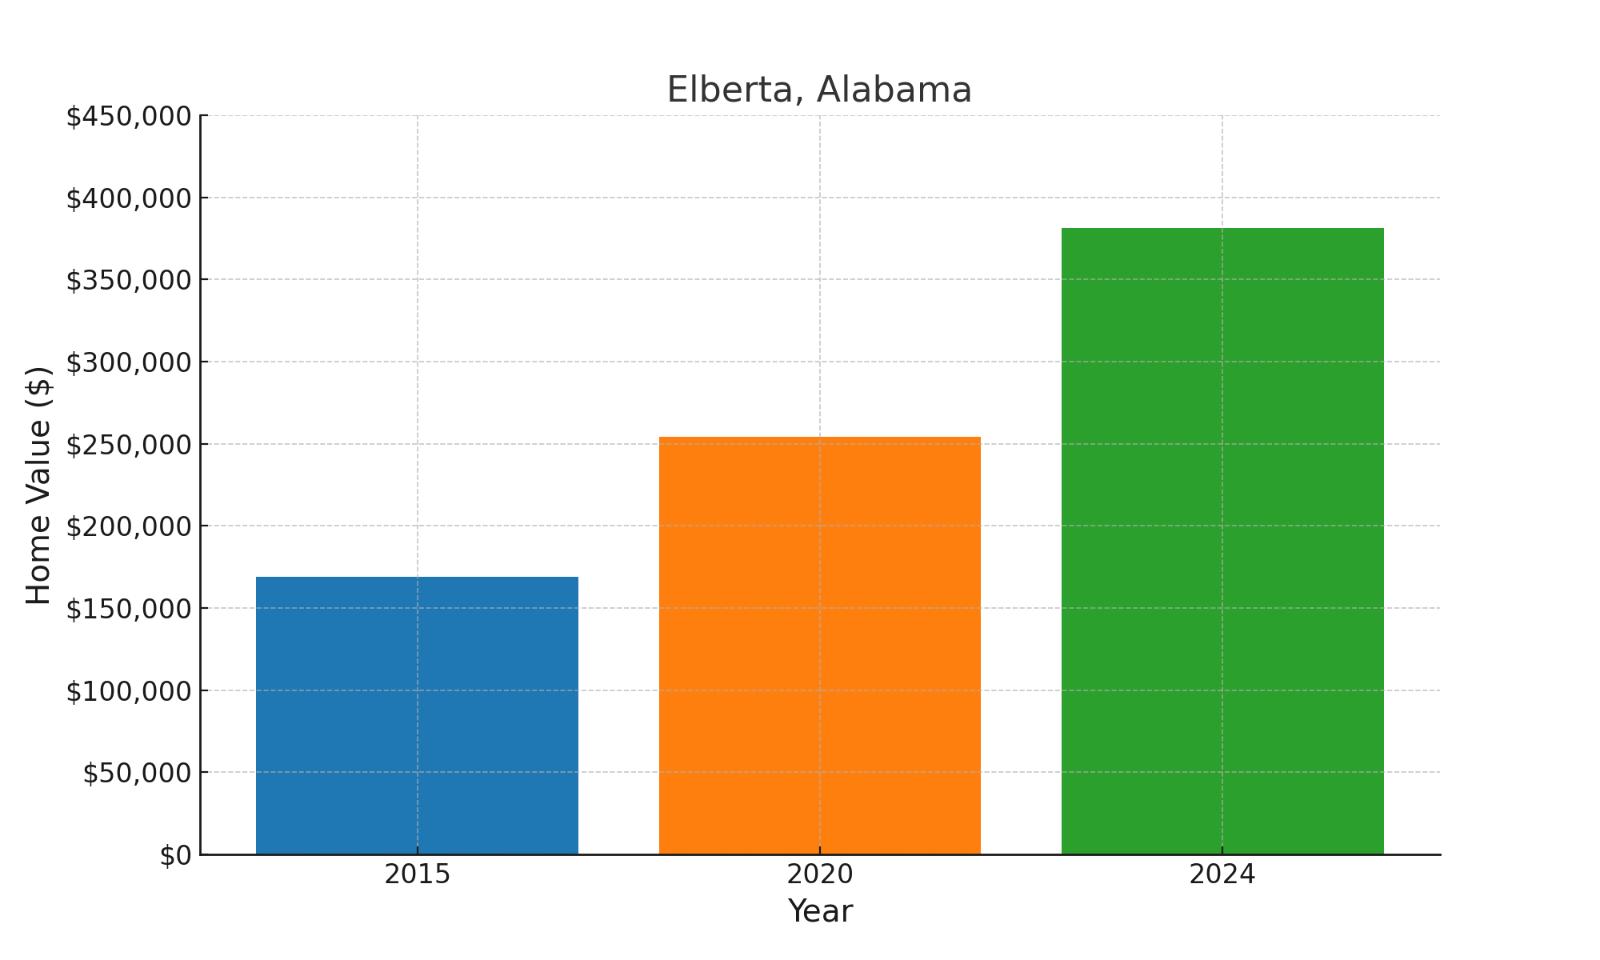
A small town in southern Baldwin County, about 10 miles inland from the Gulf Coast. Values: 2015: $168,901; 2020: $254,022; 2024: $381,314 (125.8% total increase, 50.1% since 2020).
21. Houston, AL
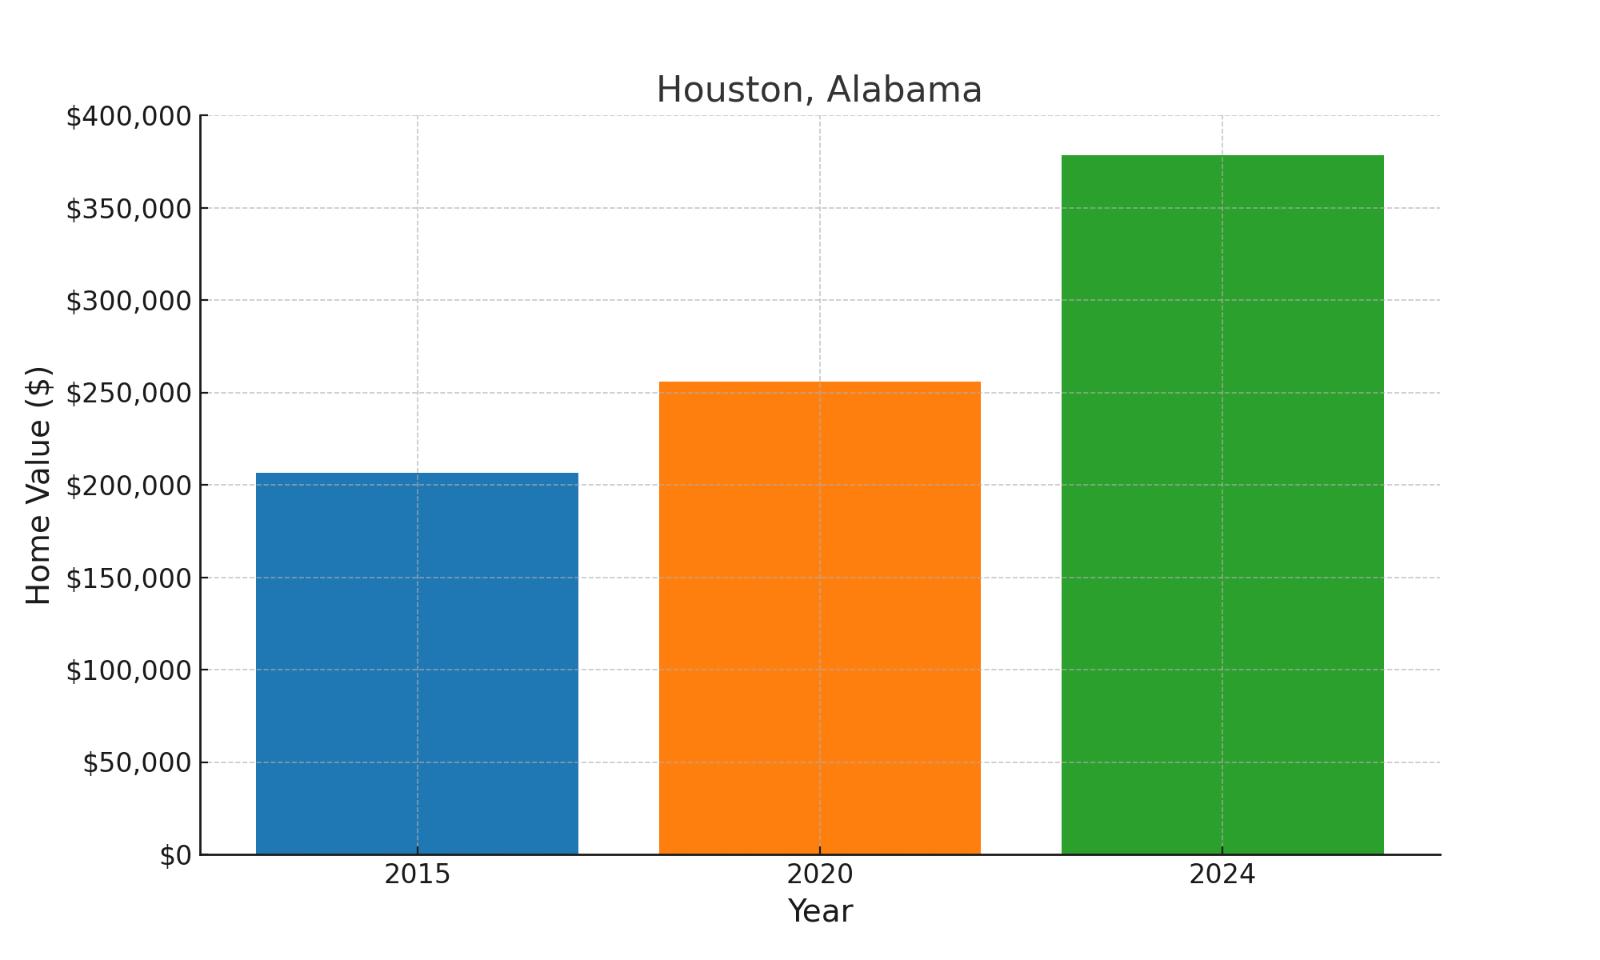
Located in northern Winston County near William B. Bankhead National Forest, about 60 miles northwest of Birmingham. Values: 2015: $206,284; 2020: $256,046; 2024: $378,410 (83.4% total increase, 47.8% since 2020).
22. Trussville, AL
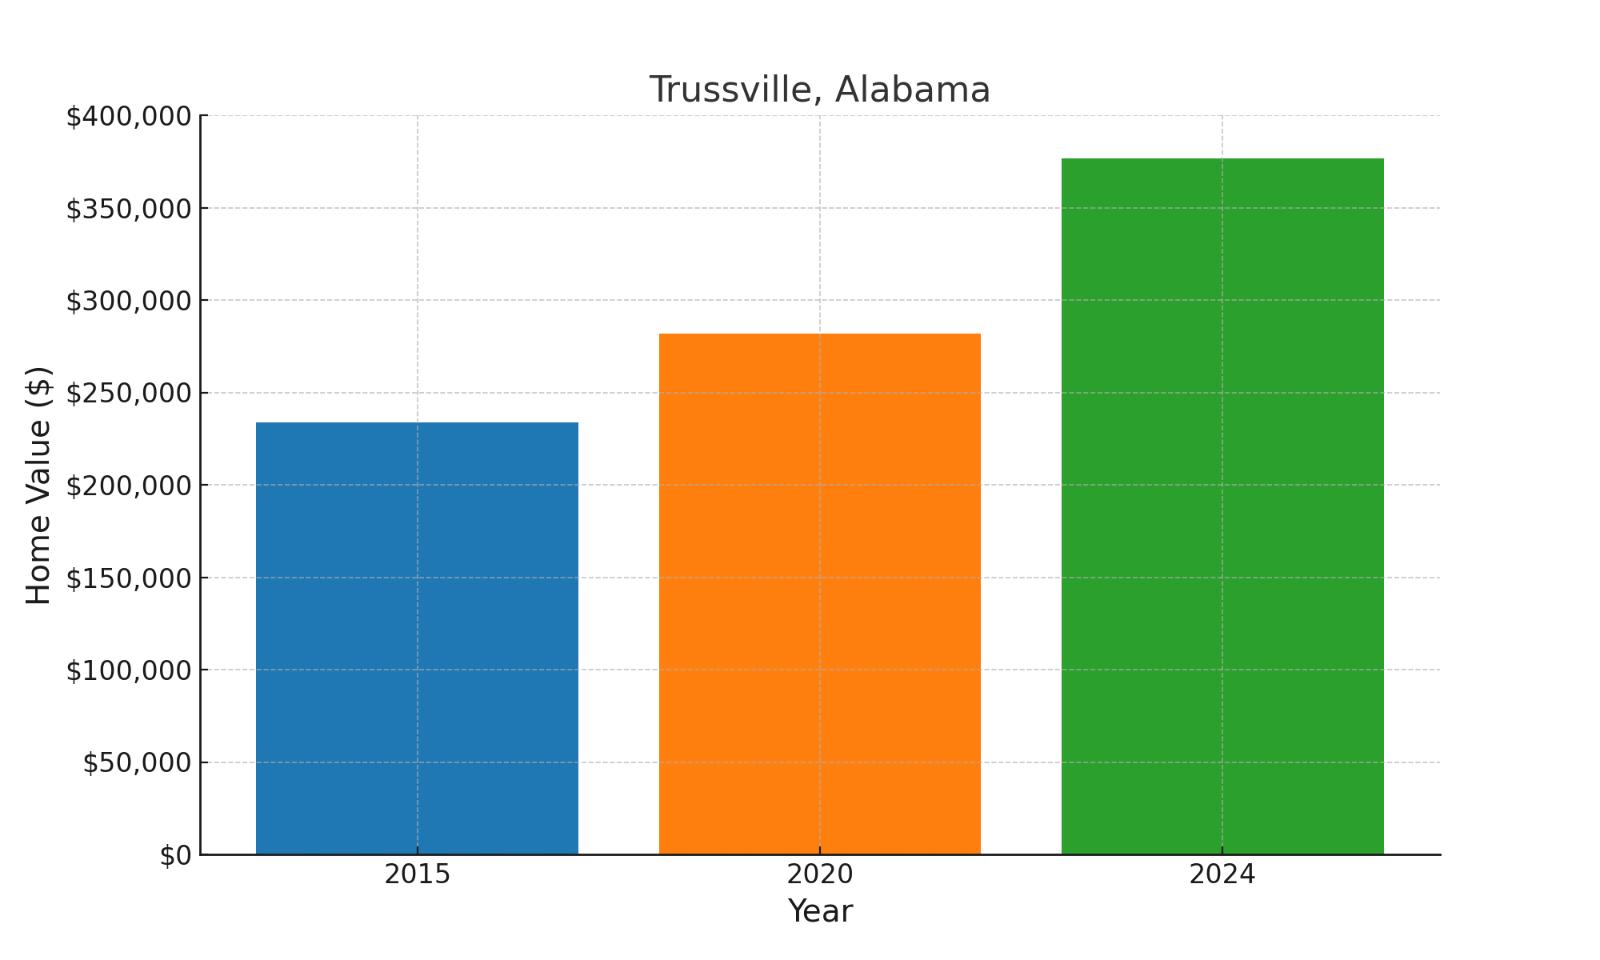
A rapidly growing suburb northeast of Birmingham along Interstate 59, known for its strong school system. Values: 2015: $233,768; 2020: $281,629; 2024: $376,723 (61.2% total increase, 33.8% since 2020).
23. Auburn, AL
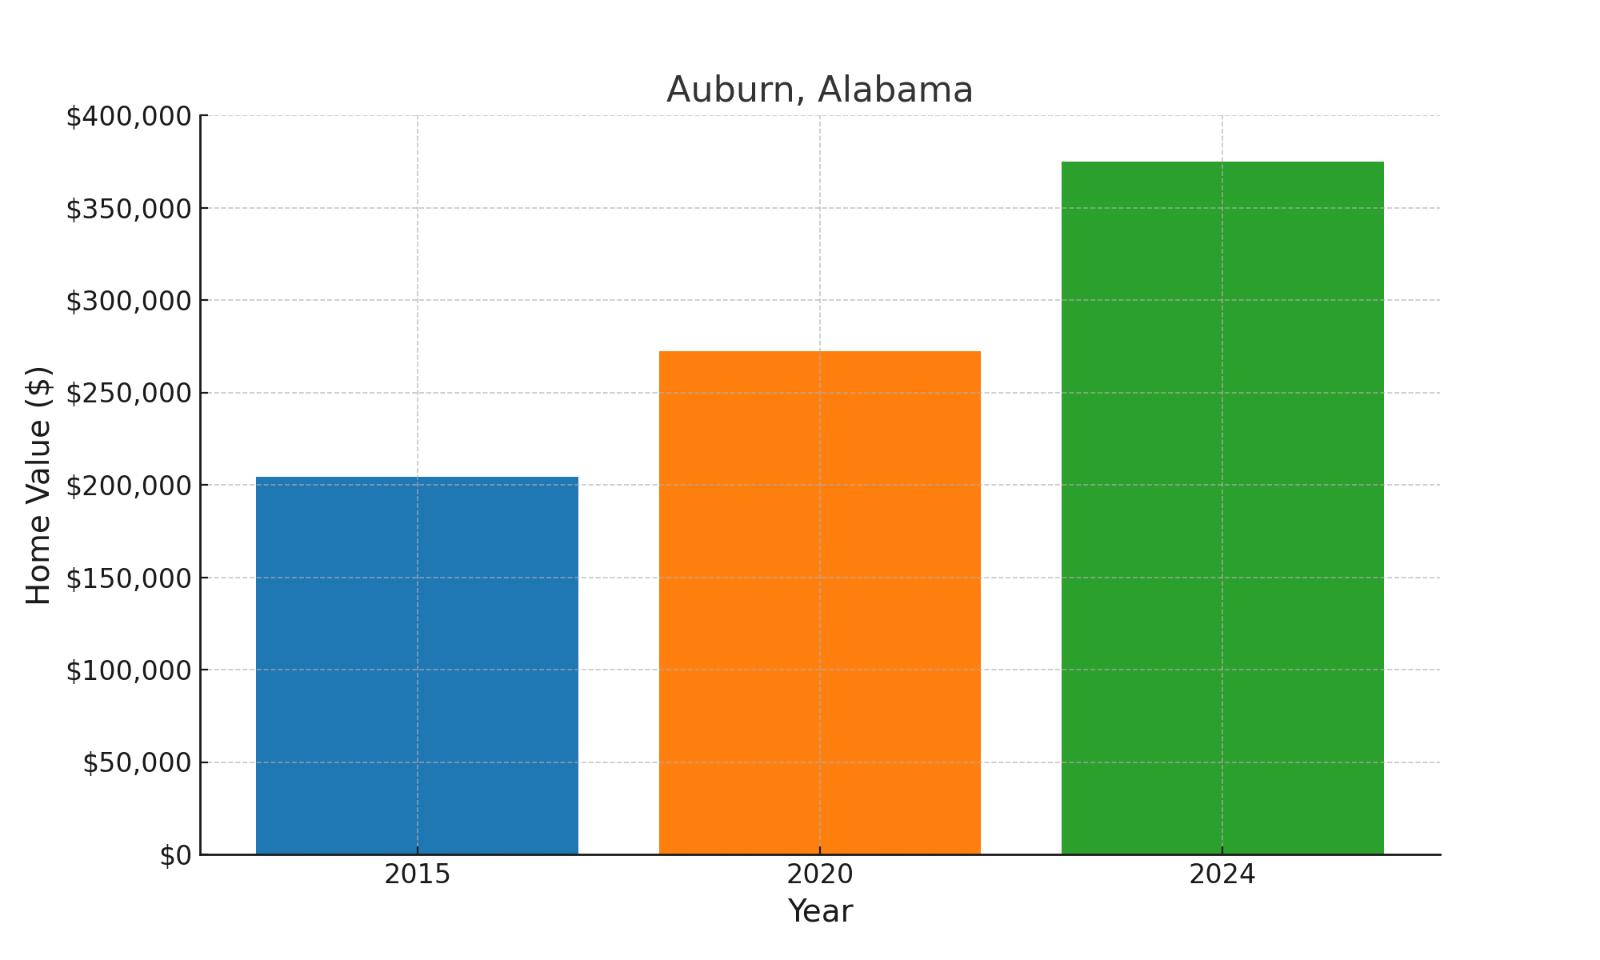
Home to Auburn University, located in east Alabama about 60 miles east of Montgomery and 30 miles west of Columbus, Georgia. Values: 2015: $204,131; 2020: $272,083; 2024: $374,953 (83.7% total increase, 37.8% since 2020).
24. Chelsea, AL
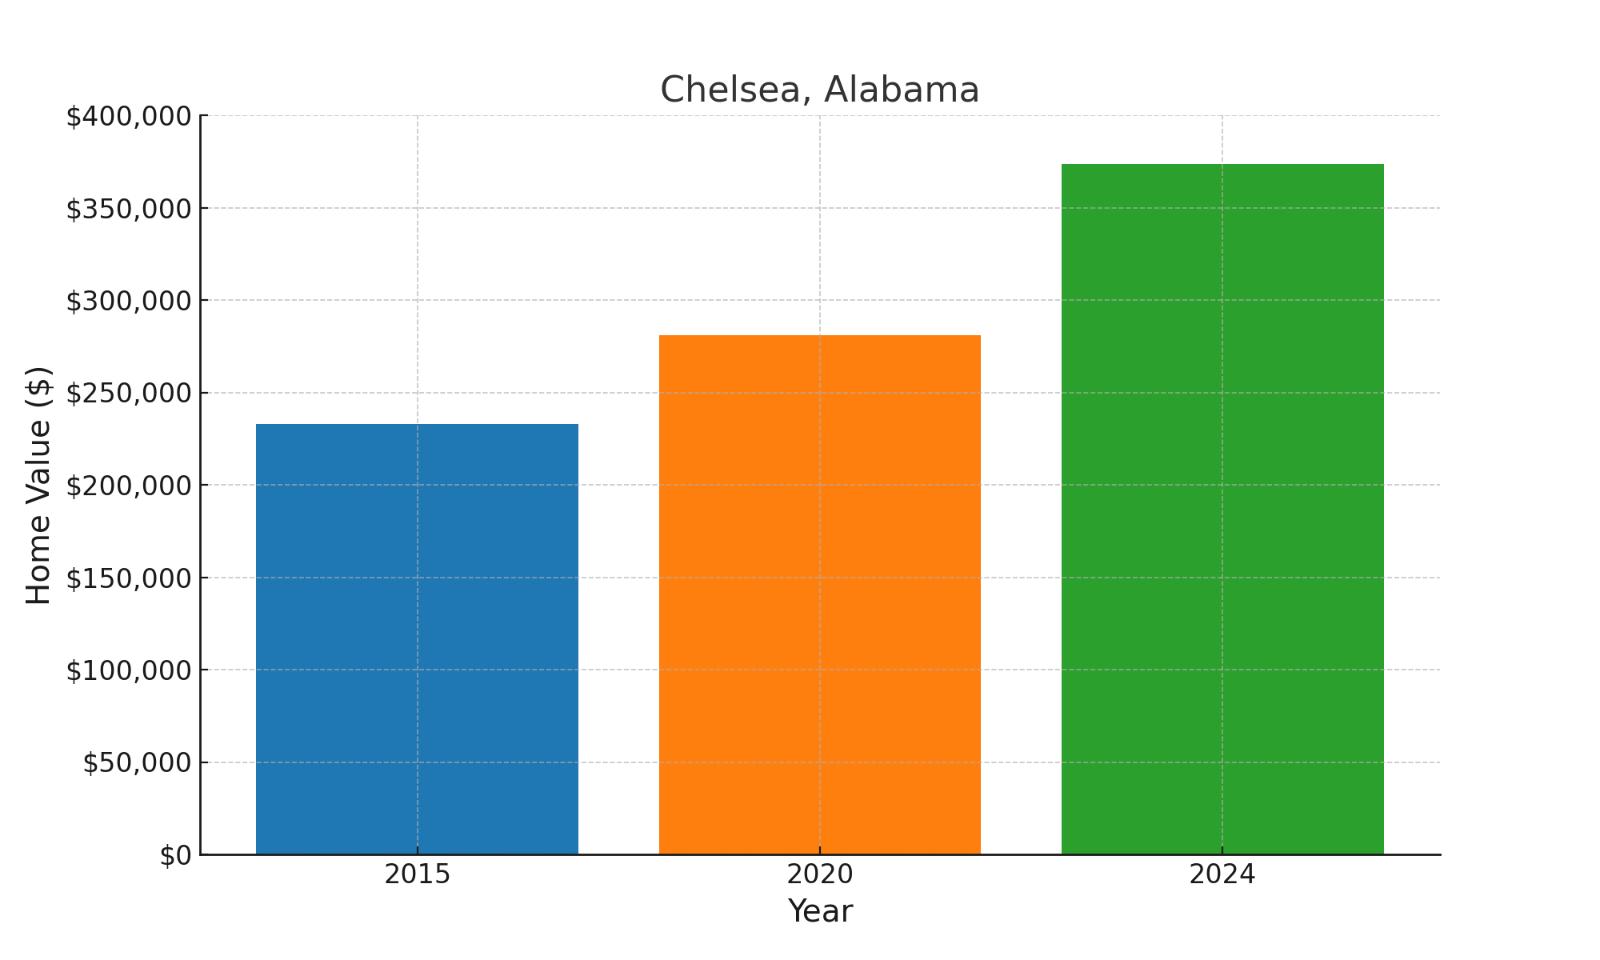
A growing suburb southeast of Birmingham in Shelby County, along U.S. Highway 280. Values: 2015: $232,779; 2020: $280,968; 2024: $373,771 (60.6% total increase, 33% since 2020).
25. Madison, AL
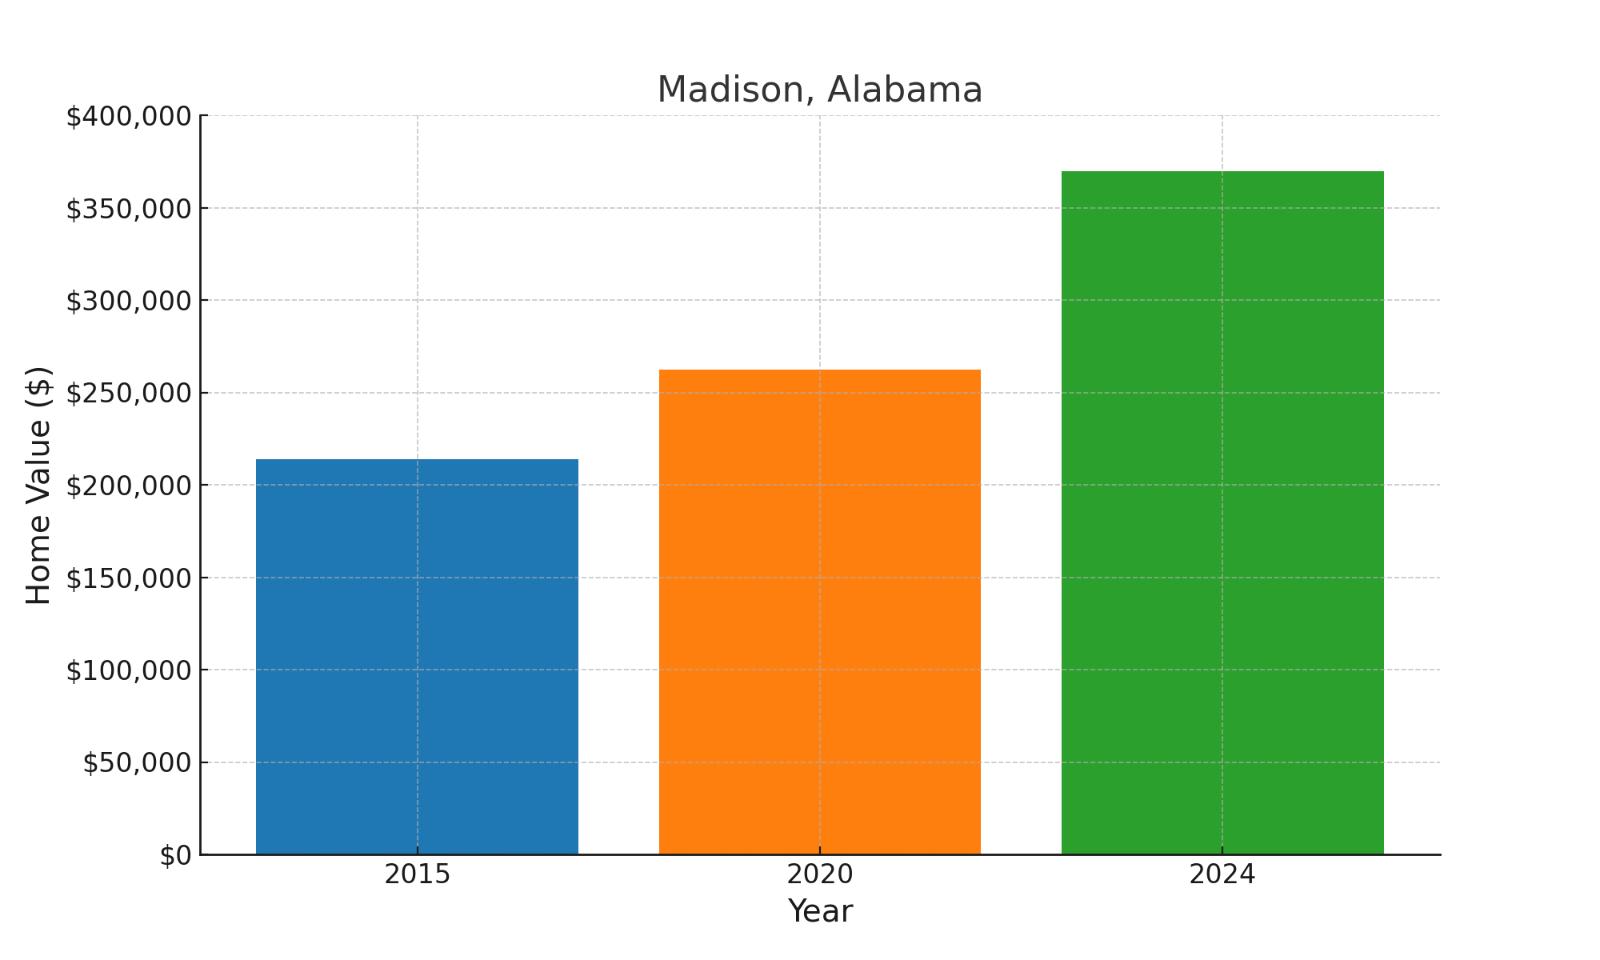
A tech-focused suburb west of Huntsville, home to many aerospace and defense industry workers. Values: 2015: $213,836; 2020: $262,252; 2024: $369,689 (72.9% total increase, 41% since 2020).